Open Access, Peer-reviewed
eISSN 2093-9752
Open Access, Peer-reviewed
eISSN 2093-9752
Seungbum Park
Kyungdeuk Lee
Daewoong Kim
Junghyeon Yoo
Jaemin Jung
Kyunghwan Park
http://dx.doi.org/10.5103/KJSB.2017.27.3.219 Epub 2017 October 15
Abstract
Objective: The aim of this study was to analyze the effects of bobsleigh shoes on the lower extremity range of motion and start speed lap time and to develop bobsleigh shoes suitable for winter environments and Korean players based on sports science and optimized biomechanical performance.
Background: The bobsleigh shoes used in the start section of the sport are one of the most important equipment for improving athletes' performances. Despite the importance of the start section, there are no shoes that are specifically designed for Korean bobsleigh athletes. Thus, Korean athletes have to wear sprint spike shoes instead of bobsleigh shoes to practice the start.
Method: The subjects included four bobsleigh athletes from the Gangwon Province Bobsleigh Skeleton Federation. The study selected the bobsleigh shoe type A (company A) and type B (company B). We analyzed the lower extremity range of motion and sprint time (start line to 10 m) using a Motion Analysis System (USA).
Results: In the measurement of the time required for the bobsleigh start section (10 m), the type A shoes demonstrated the fastest section record by 2.765±0.086 sec and yielded more efficient movements, hip and knee flexion, hip extension, ankle dorsiflexion, plantar flexion, and inversion than the type B shoes.
Conclusion: Type A shoes can yield a better performance via effective lower extremity movements in the bobsleigh start section.
Application: In the future, functional analysis should be conducted by comparing the upper material properties, comfort, and muscle fatigue of bobsleigh shoes based on the Type A shoes to develop such shoes suitable for Koreans.
Keywords
Bobsleigh Bobsleigh run Motion analysis Range of motion Sprint spike Shoe
As the 2018 PyeongChang Winter Olympic Games approaches, interest in winter sports is increasing in Korea. Bobsleigh, one of the Olympic Winter Games sports, was introduced in Korea in 2003, which has brought three consecutive silver medals and two consecutive bronze medals to Korea in the 2011-2012 season and received much attention. Such a growing interest in bobsleigh is very encouraging for the advancement of winter sports, which receive much less attention compared to summer sports. A bobsleigh race begins when the ready-to-run athletes push a 200-kg bobsled at the starting line and run at full speed of up to 55 m depending on the starting conditions of each country (Lee, 2013; Sabbioni, Melzi, Cheli, & Braghin, 2016). The bobsleigh game is divided into three sections: start section, running section, and end section (Krone, 2002). Zanoletti, La Torre, Merati, Rampinini and Impellizzeri (2006) reported that a fast start record is essential for winning bobsleigh games. The start time difference among professional players is only 1/10 sec or 1/100 of a second, but reducing 0.01 sec of the start time leads to a shortening of 0.03 sec of the overall record, with a very significant impact on the overall performance (Dabnichki & Avital, 2006; Park, Kim, & Park, 2015; Sabbioni et al., 2016; Wacker, Erdman, Nickel, & Johnson, 2007).
The factors that can affect the run at full speed include internal factors, such as quickness and endurance depending on athletes' age and training level, and kinematic factors, such as stride distance and frequency, as well as external factors, such as track surface, wind, and clothing (Daniels & Danniels, 1992). Although improvement in internal factors, including the training and efforts of athletes, may break the record in the short-distance run, such as 100-m track (Aron, Robert, & Aaron, 2003; Lee & Choi, 2010; Choi & Oh, 2015), since the results of the competition are determined by extremely slight differences in records, overcoming of external factors via the development of sports science can also shorten the record (Brownlie, Kyle, Harber, MacDonald, & Shorten, 2004; McCann, 2005; Mohr, Enders, Nigg, & Nigg, 2015; Oggiano et al., 2013; Smith, Lake, Sterzing, & Milani, 2016; Toon, Vinet, Pain, & Caine, 2011; Vinet & Caine, 2010; Vinet & Caine, 2011). Therefore, various tools and types of equipment are used to overcome external factors; footwear, which can affect the record depending on the type, is a representative example of sports science development to overcome external factors. The shoes suitable for the medium-to-long distance, such as marathon, are designed to comfort the outsole and sole to absorb the shock from the ground during the long-distance run, while the shoes for short distances, such as 100 m, 200 m, and 400 m, are designed to return energy effectively from the ground reaction force by maximizing it using a functional sole made with a hard, functional material with a high elasticity (Kim, Cho, Lee, & Park, 2009; Kwak, Mok, & Kwon, 2005). The use of hard, elastic material on the sole is also associated with the forefoot strike pattern, which is the running style during the sprint, and the difference in landing patterns can change the ankle and knee joint movements as well as the efficiency of the muscles (Chen, Hsieh, Shih, & Shiang, 2012; Hardin, Van den Bogert, & Hamill, 2004; Jung & Kim, 2012; Lin et al., 2013). To improve the gripping power and propulsion while running, a spike cleat is attached to the bottom of the shoe to prevent slipping when the foot is touching the ground and to provide a kick force; therefore, spikes suitable for short or medium-to-long distances are selected (Oh & Yoon, 2005).
Bobsleigh is similar to sprints in that athletes have to run at full speed to generate instantaneous explosive power. However, shoes for the bobsleigh game should easily control the force of sprinting off the ground and at the same time push the heavy sled from the starting point to the end point on a slippery ice track, thereby providing effective motions of the lower extremities. Nonetheless, bobsleigh players in Korea are currently training in spikes and not in bobsleigh shoes for sprints because of the limited research and development regarding bobsleigh shoes. Although shoes are provided during the competition through a sponsorship contract with an overseas shoe brand Company B, they are only available to some athletes in limited quantities. Furthermore, regarding the development of bobsleigh shoes, overseas bobsleigh shoe developers treat the material and internal structure as confidential, and there is no company in Korea that produces bobsleigh shoes. Therefore, with the ultimate goal of developing bobsleigh shoes made in Korea optimized for Korean players, this study aimed to investigate the possibility of the first prototype of bobsleigh shoes made in Korea to improve the performance of athletes by comparing the start interval record and the lower limb angle of the first prototype bobsleigh shoes and the existing model and thus to provide basic data for the next prototype development.
1. Subjects
The subjects who participated in this study were four members of the Gangwon Province Bobsleigh Skeleton Federation in Korea, who did not have any musculoskeletal disorders or signs of neurological diseases, diseases in the lumbar spine and lower extremities, or morphological changes in the feet. All subjects were also standing candidates of the national team. Experiments were conducted after receiving the voluntary participation agreements from the participants who were provided with full explanations of the purpose and content of the study. The general characteristics of the subjects are shown in (Table 1).
|
Item |
Mean ± SD |
|
Age (y) |
22.50±2.38 |
|
Weight (kg) |
89.00±10.67 |
|
Height (cm) |
179.00±0.81 |
|
Foot length
(mm) |
266.25±2.50 |
2. Experimental tools
1) Shoes for the experiment
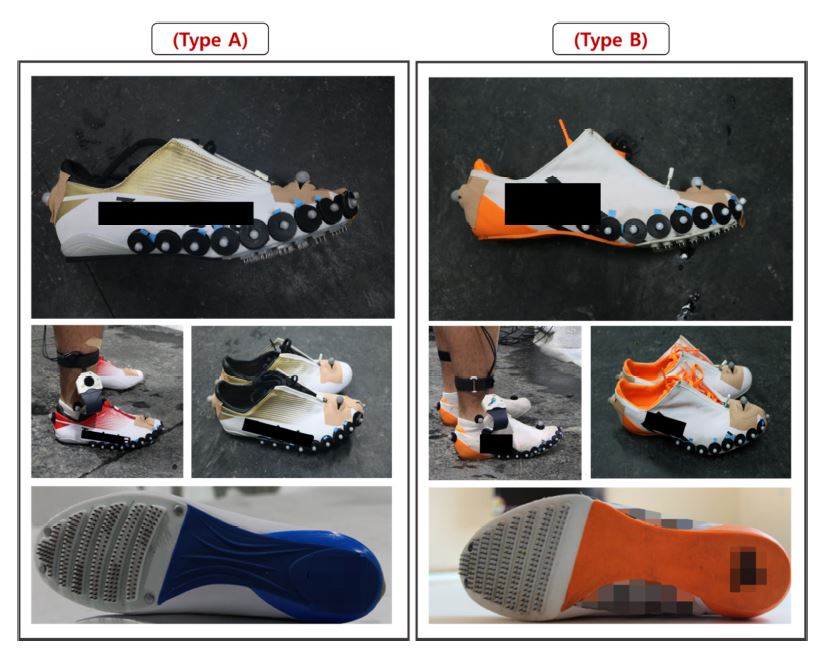
The experimental shoe used in this study was Type A shoes, which were developed as Korean bobsleigh shoes of Company A. The Korean Type A bobsleigh shoes were developed based on the result of previous studies regarding sprint spikes worn during bobsleigh athletics training, which showed an excellent start record and correlation (Park et al., 2015; Park et al., 2016). Based on their results, the Type A shoes have adopted the hardness of the last and sole based on the shoe developed for sprints, which has a hardness greater than those for medium-to-long distances. Further, the Type B shoes were referred as a control for the upper material and pin arrangement. Sponsored by overseas brand B, the Type B shoes are actually worn by bobsleigh athletes during practice or competition at the ice track stadium. Because the structure and material of the Type B shoes are treated as confidential and are thus unknown, only the outsole material was analyzed (Figure 1, Table 2).
|
Item |
Type A |
Type B |
|
Hardness
(A type) |
61 |
71 |
|
Specific
gravity (-) |
1.11 |
1.14 |
|
Tensile
strength (kg/cm2) |
17.6 |
8 |
|
Extension
rates (%) |
540 |
200 |
|
Number
of pins |
280~300 (depending
on |
280~300 (depending
on |
2) Measurement equipment
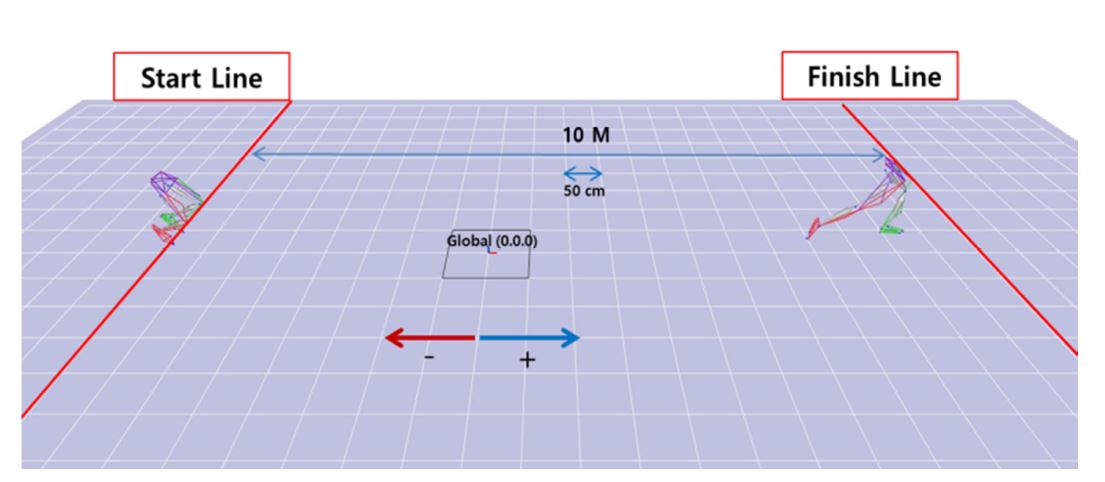
To analyze the range of motion of the hip, knee, and ankle joints during the bobsleigh start movement and the duration of each subject, a motion analysis system (Motion Analysis, USA) consisting of 22 Raptor-E infrared cameras from Motion Analysis, data station, control PC, and reflection marker were used. Three-dimensional calibration was per- formed using the nonlinear transformation method up to 12 m of the start section out of a total of 97 m of the bobsleigh ice start track: X-axis in the lateral direction, Y-axis in the front-rear direction, and Z-axis in the vertical direction. The sampling rate was set to 1,000 Hz, and data were collected at a rate of 120 frames per second (frame index time: 1/120 sec). To analyze the range of motion of the lower extremities of the subjects and the time required for the start, the Helen-Hayes Marker Set was attached only to the lower extremity, and two markers were added to the pelvis for smooth data collection. Further, the experiment was performed without removing the markers on the medial side of the knee and the ankle (Table 3). Of the collected data up to 12 m, data up to 10 m of the sprint section were used to analyze the range of movement of the leg joints through the movements of the markers using the Cortex 6.0 program (Figure 2). The time required for the V. Sacrum marker to reach 10 m after passing the start line was defined as the time required for the start, and the time to reach 5 m from the start line, 5 m to 10 m, and 10 m from the start line was compared (Figure 3).
|
Description |
Marker
name |
Placement |
|
Left
ASIS |
L. ASIS |
Anterior
superior iliac spine (ASIS) |
|
Right
ASIS |
R. ASIS |
|
|
Sacrum |
V.
Sacrum |
Superior
aspect of the L-5 sacral interface |
|
Left
Thigh Wand |
L.
Thigh |
One
lower thigh below the midpoint |
|
Right
Thigh Wand |
R.
Thigh |
|
|
Left
lateral knee |
L. knee |
Along
the flexion/extension axis of rotation at the lateral femoral condyle |
|
Right
lateral knee |
R. knee |
|
|
Left
shank wand |
L.
shank |
On the
lower shank below the midpoint |
|
Right
shank wand |
R.
shank |
|
|
Left
lateral ankle |
L.
ankle |
Along
the flexion/extension axis of rotation at the lateral malleolus |
|
Right
lateral ankle |
R.
lateral |
|
|
Left
heel |
L. heel |
Posterior
calcaneus at the same height from the floor as the toe marker |
|
Right
heel |
R. heel |
|
|
Left
toe |
L. toe |
Center
of the foot between the second and third metatarsals |
|
Right
toe |
R. toe |
|
|
Left
medial knee |
L.
medial knee |
Along
the flexion/extension axis of rotation at the medial femoral condyle |
|
Right
medial knee |
R.
medial knee |
|
|
Left
medial ankle |
L.
medial ankle |
Along
the flexion/extension axis of rotation at the medial malleolus |
|
Right
medial ankle |
R.
medial ankle |
|
|
Left
PSIS |
L. PSIS |
Posterior
superior iliac spine (PSIS) |
|
Right
PSIS |
R. PSIS |
3. Experimental procedure
This study was conducted at the ice start training center of the bob- sleigh sliding center located in PyeongChang-gun, Gangwon-do, Korea using the usual training time, considering the conditions of the athletes participating in the experiment. The subjects performed warm-up exercises beforehand with sufficiently repeated practice time to adjust to the measurement equipment installed in the bobsleigh ice start training area and the cold environment before the experiment. To make this experiment identical to the start section of the Olympic regulations, the subjects waited in a flying start position while holding a two-player bobsleigh sled at the starting line of the ice start training field and ran at a full speed while pushing the sled within 30 sec after the sign from the researcher. In the start track section of ~97 m, the subjects were instructed to ride on the sled after sprinting for ~12 m, and the collected data were analyzed up to 10 m. A total of three repetitions were performed for each shoe type, and the mean value was selected. The subjects were provided with sufficient rest time for at least 10 min between each repetition to eliminate the accumulation of fatigue, and arctic clothes were provided to maintain the body temperature during rest. The shoe type was selected randomly.
4. Data processing
Quantitative data processing was not possible for this study because of the limited number of subjects. Therefore, the maximum ranges of motion of the joints in the X, Y, and Z-axes of the hip, knee, and ankle were averaged on the basis of the three repetitions for each shoe type to compare the differences between the Type A and Type B shoes.
1. Time required for the start movement
The analysis of the start time of the bobsleigh showed that the Type A shoes had a shorter record with a -0.005-sec difference compared with the Type B shoes (Type A: 1.758 ± 0.056 sec vs Type B: 1.763 ± 0.073 sec in the start line-to-5 m interval). In the 5 m-to-10 m interval, the Type A shoes had a record of 1.007 ± 0.037 sec, while the Type B shoes had a record of 1.011 ± 0.040 sec; the Type A shoes had a record of 2.765 ± 0.086 sec in the entire section up to 10 m, and the Type B shoes had a record of 2.773 ± 0.110 sec in the start line-to-10 m interval; in both cases, the Type A shoes revealed a shortened record by 0.004 and 0.008 sec, respectively (Table 4).
|
|
Type A |
Type B |
Type A - |
|
Start line to 5 m |
1.758±0.056 |
1.763±0.073 |
-0.005 |
|
5 m to 10 m |
1.007±0.037 |
1.011±0.040 |
-0.004 |
|
Start line to 10 m |
2.765±0.086 |
2.773±0.110 |
-0.008 |
2. Analysis of the start section lower extremity range of motion using a three-dimensional motion analysis
1) Hip range of motion
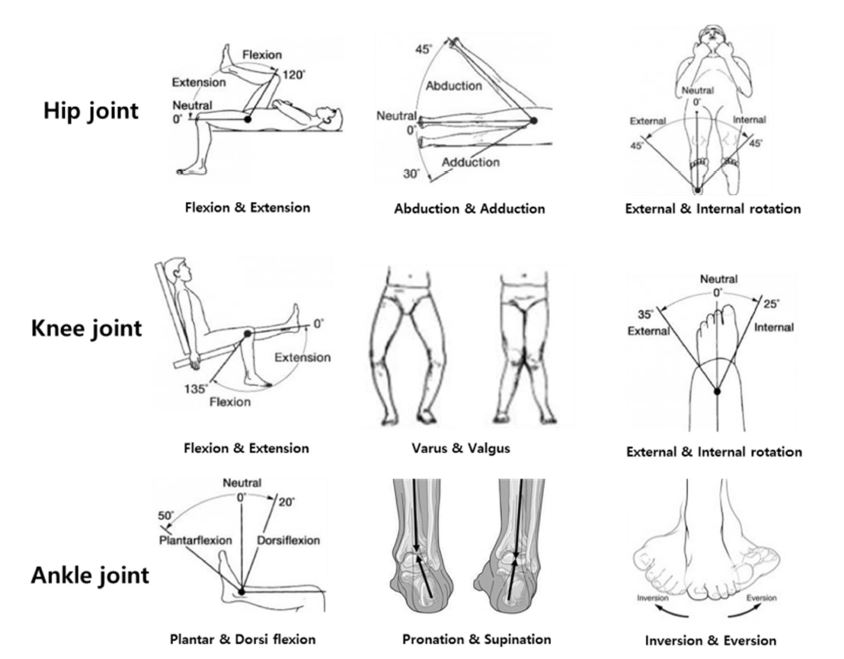
In the bobsleigh start movement, the range of motion of the hip joint in the X-axis was analyzed as Type A < Type B for the right hip extension, Type A > Type B for flexion, Type A < Type B for the left hip extension, and Type A > Type B for flexion; in the Y-axis as Type A < Type B for the right hip adduction, Type A > Type B for abduction, Type A < Type B for the left hip adduction, and Type A > Type B for abduction; and in the Z-axis as Type A > Type B for external rotation in the right leg, Type A > Type B for internal rotation, Type A > Type B for external rotation in the left leg, and Type A < Type B for internal rotation (Table 5).
2) Knee joint range of motion
In the bobsleigh start movement, the range of motion of the knee joint in the X-axis was analyzed as Type A > Type B for the right knee extension, Type A > Type B for flexion, Type A < Type B for the left knee extension, and Type A > Type B for flexion; in the Y-axis as Type A > Type B for the right knee adduction, Type A > Type B for abduction, Type A < Type B for the left knee adduction, and Type A > Type B for abduction; and in the Z-axis as Type A > Type B for external rotation in the right knee, Type A > Type B for internal rotation, Type A > Type B for external rotation in the left knee, and Type A < Type B for internal rotation (Table 5).
3) Ankle joint range of motion
In the bobsleigh start movement, the range of motion of the ankle joint in the X-axis was analyzed as Type A < Type B for the right ankle joint dorsiflexion, Type A > Type B for plantarflexion, Type A < Type B for the left ankle joint dorsiflexion, and Type A > Type B for plantarflexion; in the Y-axis as Type A > Type B for the right ankle pronation, Type A < Type B for supination, Type A < Type B for the left ankle pronation, and Type A < Type B for supination; and in the Z-axis as Type A < Type B for inversion in the right ankle, Type A < Type B for eversion, Type A < Type B for inversion in the left ankle, and Type A > Type B for eversion (Table 5).
|
Hip joint |
|
Right hip joint |
|
Left side hip joint |
||||
|
Type A |
Type B |
A-B |
Type A |
Type B |
A-B |
|||
|
Extension |
22.60±16.88 |
27.42±13.04 |
-4.82 |
|
17.97±12.58 |
21.60±11.28 |
-3.63 |
|
|
Flexion |
91.15±17.35 |
88.15±15.45 |
3 |
|
89.92±19.33 |
89.72±21.69 |
0.2 |
|
|
Adduction |
12.24±5.15 |
12.50±4.68 |
-0.26 |
|
6.97±5.59 |
7.76±2.63 |
-0.79 |
|
|
Abduction |
7.18±5.74 |
6.79±3.93 |
0.39 |
|
15.14±4.35 |
14.28±5.45 |
0.86 |
|
|
External rotation |
14.66±4.06 |
13.65±5.24 |
1.01 |
|
21.37±8.27 |
19.42±9.21 |
1.95 |
|
|
Internal rotation |
17.10±8.17 |
15.29±6.02 |
1.81 |
|
9.93±5.64 |
13.11±9.79 |
-3.18 |
|
|
Knee joint |
|
Right knee joint |
|
Left knee joint |
||||
|
|
Type A |
Type B |
A-B |
|
Type A |
Type B |
A-B |
|
|
Extension |
-14.54±6.06 |
-6.85±3.45 |
2.31 |
|
-5.14±4.01 |
-5.06±3.16 |
-0.08 |
|
|
Flexion |
121.88±7.62 |
120.09±10.76 |
1.79 |
|
127.21±7.96 |
126.94±12.06 |
0.27 |
|
|
Varus |
13.01±6.59 |
12.26±5.09 |
0.75 |
|
10.13±3.87 |
12.77±4.64 |
-2.64 |
|
|
Valgus |
8.25±7.41 |
7.45±4.18 |
0.8 |
|
7.55±5.90 |
5.84±3.11 |
1.71 |
|
|
External rotation |
20.87±6.18 |
21.05±5.70 |
-0.18 |
|
22.04±8.59 |
23.64±13.11 |
-1.6 |
|
|
Internal rotation |
2.22±4.05 |
3.39±5.11 |
-1.17 |
|
0.72±5.26 |
-0.76±7.40 |
1.48 |
|
|
Ankle joint |
|
Right side |
|
Left side |
||||
|
|
Type A |
Type B |
A-B |
|
Type A |
Type B |
A-B |
|
|
Dorsiflexion |
25.85±3.93 |
28.02±4.41 |
-2.17 |
|
23.04±3.59 |
27.42±3.61 |
-4.38 |
|
|
Plantar flexion |
46.70±11.34 |
43.98±9.91 |
2.72 |
|
43.61±8.87 |
42.22±7.05 |
1.39 |
|
|
Pronation |
16.27±4.57 |
13.89±5.29 |
2.38 |
|
15.46±2.55 |
17.45±4.61 |
-1.99 |
|
|
Supination |
8.49±4.90 |
11.04±5.08 |
-2.55 |
|
6.61±3.17 |
7.95±3.34 |
-1.34 |
|
|
Inversion |
17.17±2.61 |
17.99±4.07 |
-0.82 |
|
16.90±6.79 |
20.22±8.69 |
-3.32 |
|
|
|
Eversion |
-2.33±4.47 |
-3.98±3.55 |
1.65 |
|
5.49±6.88 |
1.38±4.05 |
4.11 |
Walking is divided into the stance phase when the foot touches the ground and the swing phase when the foot is lifted off the ground; these two cycles are alternating rhythmically at a ratio of 6:4, respectively (Perry & Burnfield, 2010). Running is the fastest movement for humans, showing the larger ranges of motion of the lower extremity joints in the stance phase and swing phase than those while walking, and has a double air phase in which both feet lift off of the ground owing to the propulsion force during the stance phase (Bae, 2010; Novacheck, 1998). In short-distance sprints, such as 100-m and 200-m sprints on the track, it is more important to increase the stride number and stride length compared with those in typical walking or running, which requires an efficient and large range of motion. An efficient range of joint motion depends largely on the shoes, which can easily absorb and return the energy from the ground reaction force based on the stable support. Further, it is an indispensable equipment for the start in bobsleigh where the athletes have to pull a heavy sled in an unstable ground, such as ice.
Propulsion is one of the most important functions of sprint shoes, and optimization of sole hardness, sole thickness, etc. is used as a method to improve propulsion (Kwak et al., 2005; Kim et al., 2009). Moreover, the instability of the ankle during walking or running is deter- mined by pronation and adduction, and as a result, rearfoot movement is also important in developing sprint shoes (Kwak & Lee, 1997; Tang et al., 2015). The analysis of the time required for the start in bobsleigh in this study showed that the start time wearing the Type A shoes shortened the records compared with that wearing the Type B shoes in the initial interval of up to 5 m from the start line as well as in the 5 m-to-10 m interval. The analysis of the range of motion of the ankle showed that the Type A and Type B shoes showed different tendencies on the right and left in the pronation of the ankle, whereas the Type A shoes tended to show a lower range of motion than the Type B shoes, indicating a stable support of the former to the lower extremities on the slippery floor. The Type B shoes showed a higher range of motion than the Type A shoes in dorsiflexion; conversely, the Type A shoes showed a higher range of motion than the Type B shoes in plantarflexion. The last in the Type A shoes used in the study was designed on the basis of the sprint spike developed for a short-distance track in a previous study while using a hard material for the sole. Willwacher, König, Potthast and Brüggemann (2013) and Willwacher, König, Braunstein, Goldmann and Brüggemann (2014) have reported that the outsole and midsole with a high hardness in the forefoot region are effective not only in restricting movements of the metatarsophalangeal joint during running but also in returning energy to gain propulsion during running. Similarly, the Type A shoes in this study showed greater plantarflexion movements after low dorsiflexion motion owing to the high hardness of the sole than the Type B shoes; therefore, the former showed a uniaxial contraction energy caused by the stretch reflex of the calf muscles, and the flexion moment of the Type A shoes has positively contributed to the shortening of the start interval record.
Stride speed is a factor that may affect the walking pattern, and stride length and frequency increase to increase the walking speed as well (Mercer, Bezodis, Russell, Purdy, & DeLion, 2005; Schwartz, Rozumalski, & Trost, 2008), which can be achieved by changing the range of motion of the joint. According to Novacheck (1998), sprinting, such as running at full speed, uses a strategy of widening the stride as the hip flexion angle and knee flexion angle increase as the gait speed increases, compared to typical walking and jogging. In this study, the Type A shoes were more likely to increase the hip flexion and knee flexion than the Type B shoes. This suggests that the Type A shoes provide a stable support to the ankle during the stance phase, resulting in an increased mobility in the opposite mid swing.
It was reported that the hip joint extension occurs during the terminal stance phase to obtain the propulsion force, and the angle of extension increases as the greater propulsion force is required (Novacheck, 1998). However, the hip flexion angle in this study was smaller in the Type A shoes than in the Type B shoes, showing inconsistent results compared with those of a previous study. The crouching start movement during the short-distance track uses a reaction force by kicking the starting block when the center of mass of the body is directed forward, maximizing the unstable state. In a comparative study of skilled and unskilled athletes in the crouching start, the horizontal displacement of the center of gravity from the start to three strides shifted further in the skilled athletes; yet, the vertical displacement was lower in the skilled athletes than in the unskilled athletes (Oh, Shin, Hong, Lim, & Yang, 2015). Players of bobsleigh, as in the crouching start in sprints, must focus the force direction on horizontal displacement rather than the vertical direction to push the heavy sled at the start; thus, it is advantageous if the center of mass of the body is directed forward so that the force is transmitted to the sled. As a result, as the center of the body is tilted forward, the hip joints also display reduced extension to minimize the loss of vertical displacement. However, the Type A shoes increased the abduction and external rotation of the hip joint and eversion of the knee joint compared with the Type B shoes. This suggests that the Type A shoes provide a stable support to shift the center of mass effectively for pushing when the athletes push the heavy sled, thereby increasing the ranges of motion in abduction and external rotation of the hip joint and eversion of the knee joint during the stance phase.
It may be difficult to generalize the results via a quantitative data analysis owing to the limitation of this study in which only four national bobsleigh standing candidates participated because of the characteristics of bobsleigh in Korea. Moreover, there was no distinction between the start event and the sprint event in which the gait pattern can be changed, and the maximum value of the entire 10-m section of the data was selected for the comparison. Therefore, more detailed biomechanical studies on developing prototypes for Korean bobsleigh shoes are necessary for bobsleigh players.
To develop Korean bobsleigh shoes optimized for Korean athletes, the start interval and the joint angles in the lower extremities were recorded for each bobsleigh shoe type, and the following conclusions were obtained.
1. The analysis of the time required for the start in bobsleigh showed that the start time wearing the Type A shoes shortened the records compared with that wearing the Type B shoes in the initial interval of up to 5 m from the start line as well as in the 5 m-to-10 m interval.
2. The comparison of the range of motion of the lower extremity joints at the bobsleigh start showed that the Type A shoes were more efficient than the Type B shoes in terms of hip and knee flexion, ankle plantarflexion and dorsiflexion, and inversion.
References
1. Aron, J. M., Robert, G. L. & Aaron, J. C. (2003). Kinematic determines of early acceleration on field sport athletes. Journal of Sports Science and Medicine, 2(3), 144-150.
Crossref
Google Scholar
2. Bae, S. J. (2010). Children's Running Motion Character by Velocity-Change. The Korean Journal of the Elementary Physical Education, 16(3), 103-112.
Crossref
3. Brownlie, L. W., Kyle, C. R., Harber, E., MacDonald, R. & Shorten, M. R. (2004). Reducing the aerodynamic drag of sports apparel: development of the NIKE Swift sprint running and SwiftSkin speed skating suits. The Engineering of Sport, 5, 90-96.
Crossref
Google Scholar
4. Chen, C. H., Hsieh, C. F., Shih, Y. & Shiang, T. Y. (2012).
Crossref
5. Choi, S. N. & Oh, C. H. (2015). Comparative Kinematical Analysis of Medium Start 100m Starting Phase in University athlete. Journal of Korean Society for the Study of Physical Education, 20(2), 89-100.
Crossref
6. Daniels, J. T. & Danniels, N. (1992). Running economy of elite male and elite female runners. Medicine and Science in Sports and Exercise, 24, 483-489.
Crossref
Google Scholar
PubMed
7. Dabnichki, P. & Avital, E. (2006). Influence of the position of crew members on aerodynamics performance of two-man bobsleigh. Journal of Biomechanics, 39(15), 2733-2742.
Crossref
Google Scholar
PubMed
8. Hardin, E. C., Van den Bogert, A. J. & Hamill, J. (2004). Kinematic adap- tations during running: effects of footwear, surface, and duration. Medicine and Science in Sports and Exercise, 36(5), 838-844.
Crossref
Google Scholar
9. Jung, J. H. & Kim, J. T. (2012). Comparative analysis on muscle Function and EMG of trunk and lower extremity in short and long distance athlete. Korean Journal of Sport Biomechanics, 22(1), 9-16.
Crossref
Google Scholar
10. Kim, S. H., Cho, J. R., Lee, S. B. & Park, S. B. (2009). Evaluation of landing impact characteristics of sport shoes in running by finite element analysis. Korea Journal of Sport Biomechanics, 19(2), 217-225.
Crossref
Google Scholar
11. Krone, D. (2002). Federation Internationale de Bobsleigh et de Tobog- ganing (FIBT). Federation Internationale de bobsleigh et de toboganning.
Crossref
12. Kwak, C. S. & Lee, K. S. (1997). The influence of regional midsole hardness of forefoot and rearfoot on rearfoot control variables and torsion angle in running. The Korean Journal of Physical Education, 36(4), 337-347.
Crossref
13. Kwak, C. S., Mok, S. H. & Kwon, O. B. (2005). The influence of midsole hardness and sole thickness of sport shoes on ball flex angle with the increment of running velocity. Korea Journal of Sport Biomechanics, 15(4), 153-168.
Crossref
Google Scholar
14. Lee, A. Y. (2013). Relationship between muscle power and starting speed in Bobsleigh athletes. Un-published Master's Thesis. Korea National Sport University.
Crossref
15. Lee, J. H. & Choi, S. N. (2010). A Muscles activity Analysis of Crouching Starting motion of College Sprinter. Journal of Korean Society for the Study of Physical Education, 15(2), 385-394.
Crossref
16. Lin, S. C., Chen, C. P., Tang, S. F., Wong, A. M., Hsieh, J. H. & Chen, W. P. (2013). Changes in windlass effect in response to different shoe and insole designs during walking. Gait & Posture, 37(2), 235-241.
Crossref
Google Scholar
PubMed
17. McCann, J. (2005). Material requirements for the design of performance sportswear. Shishoo. R.(Ed). Textiles in Sport.
Crossref
Google Scholar
18. Mercer, J. A., Bezodis, N. E., Russell, M., Purdy, A. & DeLion, D. (2005). Kinetic consequences of constraining running behavior. Journal of Sports Science and Medicine, 4, 144-152.
Crossref
Google Scholar
19. Mohr, M., Enders, H., Nigg, S. R. & Nigg, B. M. (2015). The Effect of Shoe Weight on Sprint Performance: A Biomechanical Perspective. J Ergonomics S, 6(2).
Crossref
Google Scholar
20. Novacheck, T. F. (1998). The biomechanics of running. Gait & Posture, 7(1), 77-95.
Crossref
Google Scholar
PubMed
21. Oh, C. H., Shin, E. S., Hong, S. Y., Lim, S. H. & Yang, S. J. (2015). Kinematic analysis on 100 m crouching start movement of female high school athletes. The Korea Journal of Sports Science, 24(5), 1641-1651.
Crossref
22. Oggiano, L., Brownlie, L., Troynikov, O., Bardal, L.M., Sæter, C. & Sætran, L. (2013). A review on skin suits and sport garment aerodynamics: guidelines and state of the art. Procedia Engineering, 60, 91-98.
Crossref
Google Scholar
23. Oh, B. S. & Yoon, S. J. (2005). The analysis of sprint skills in track and field. Journal of Coaching Development, 7(2), 107-117.
Crossref
24. Park, J. J., Kim, K. H. & Park, S. B. (2015). The Analysis of foot pressure and lap time for the development of Korean bobsleigh shoes. Korean Journal of Sport Biomechanics, 25(4), 465-474.
Crossref
Google Scholar
25. Park, S., Lee, K., Ki, M, D., Lee, J., Jung, J., Park, K., Park, S. & Kim, J. (2016). Analysis of Forefoot Bending Angle in Sprint Spikes According to Bobsleigh Start Lap Time for Development of Korean-Specific Bobsledding Shoes. Korean Journal of Sport Biomechanics, 26(3), 315-321.
Crossref
Google Scholar
26. Perry, J. & Burnfield, J. M. (2010). Gait Analysis: Normal and Pathological Function. Second Edition. SLACK, New Jersey.
Crossref
Google Scholar
27. Sabbioni, E., Melzi, S., Cheli, F. & Braghin, F. (2016). Bobsleigh and skeleton. The Engineering Approach to Winter Sports, 183-276.
Crossref
Google Scholar
28. Schwartz, M. H., Rozumalski, A. & Trost, J. P. (2008). The effect of walking speed on the gait of typically developing children. Journal of Biomechanics, 41(8), 1639-1650.
Crossref
Google Scholar
29. Smith, G., Lake, M., Sterzing, T. & Milani, T. (2016). The influence of sprint spike bending stiffness on sprinting performance and metatarsophalangeal joint function. Footwear Science, 8(2), 109-118.
Crossref
Google Scholar
30. Tang, S. F. T., Chen, C. H., Wu, C. K., Hong, W. H., Chen, K. J. & Chen, C. K. (2015). The effects of total contact insole with forefoot medial posting on rearfoot movement and foot pressure distributions in patients with flexible flatfoot. Clinical Neurology and Neurosurgery, 129, 8-11.
Crossref
Google Scholar
31. Toon, D., Vinet, A., Pain, M. T. & Caine, M. P. (2011). A methodology to investigate the relationship between lower-limb dynamics and shoe stiffness using custom-built footwear. Proceedings of the Institution of Mechanical Engineers, Part P: Journal of Sports Engineering and Technology, 225(1), 32-37.
Crossref
Google Scholar
32. Vinet, A. & Caine, M. (2010). Development of traction features in sprint spikes using SLS nylon sole units. Procedia Engineering, 2(2), 2769 -2774.
Crossref
Google Scholar
33. Vinet, A. & Caine, M. P. (2011). Design, manufacture, and evaluation of traction features on sprint footwear using laser sintered nylon-12 sole units. Proceedings of the Institution of Mechanical Engineers, Part P: Journal of Sports Engineering and Technology, 225(4), 259 -264.
Crossref
Google Scholar
34. Wacker, M., Erdman, A., Nickel, T. & Johnson, M, G. (2007). Design, Build, and Test of a Bobsled Simulator for Olympic Athletes. Journal of Medical Devices, 1(1), 96-102.
Crossref
Google Scholar
35. Willwacher, S., König, M., Potthast, W. & Brüggemann, G. P. (2013). Does specific footwear facilitate energy storage and return at the meta- tarsophalangeal joint in running. Journal of Applied Biomechanics, 29(5), 583-592.
Crossref
Google Scholar
36. Willwacher, S., König, M., Braunstein, B., Goldmann, J. P. & Brüggemann, G. P. (2014). The gearing function of running shoe longitudinal bending stiffness. Gait & Posture, 40(3), 386-390.
Crossref
Google Scholar
PubMed
37. Zanoletti, C., La Torre, A., Merati, G., Rampinini, E. & Impellizzeri, F. M. (2006). Relationship between push phase and final race time in skeleton performance. The Journal of Strength & Conditioning Research, 20(3), 579-583.
Crossref
Google Scholar
