Open Access, Peer-reviewed
eISSN 2093-9752
Open Access, Peer-reviewed
eISSN 2093-9752
Moon-Seok You
Kyung-Ill Lee
http://dx.doi.org/10.5103/KJSB.2016.26.1.83 Epub 2016 April 20
Abstract
This study aimed to compare differences in biomechanical factors according to distance changes in relation to approaches during a round of golf to obtain basic data on golf swings.
The research subjects were 8 KPGA-affiliated professional golfers who performed approach shots that put a ball into a circle of 8 feet in diameter from distances of 30, 50, and 70 m. Data were collected by using six infrared cameras and a ground reaction force device, which were applied to calculate biomechanical factors by using Kwon3D XP. The calculated data were subjected to one-way ANOVA by using SPSS 20.0, with the significance level set at p value of 0.05.
Elapsed time, stance width, clubhead position variation, clubhead synthesis speed, and cocking angle significantly differed according to distance change during the approach swing. Clubhead speed was positively related with stance width and clubhead displacement. Ground reaction force significantly differed according to distance change during the approach swing. Factors before and after showed differences in other states, except in the impact state.
In the present study, we drew several conclusions regarding biomechanical factors and ground reaction forces according to distance change in the approach swing of professional golfers. According to these conclusions, we suggest that distance control with swing range is more important than power control in maintaining the accuracy and consistency of golf swing and is the most important mechanism of golf swing.
Keywords
Approach Biomechanical KPGA Ground reaction force
Golf swing is an exercise that requires advanced tech- nique and scientific thought. It relies on rotation of body segments and complex continuous movement of joints (Kim et al., 2009). This ability to control the body can reduce the score by balancing two factors, the power to produce long distance and the accuracy to send the ball in the desired direction. Double precision requires consis- tency of the swing, which is one of the most complicated characteristics of human body movement. Many profes- sional golf players work hard to establish a body mechanical system known as "routine" for swing consistency. However, golf is a sport where the world's top-ranked players do not always stay on top, and the low-ranked players are seen winning. Even though players are quite good, it is difficult for them to always have consistent rotation of body segments and continuous movement of joints (Lee, Ryu, & Hong, 2015). In addition, depending on the char- acteristics of the course and distance from the target, the players will use a different club or adjust the distance with the same club (Kim, 2007), making it difficult to preserve consistency.
From setup (address), backswing, downswing, impact, and follow-through phases to finish, each individualized movement in golf is made step by step according to the respective characteristics. Distance is adjusted by a coord- ination of kinetic factors arising from each movement. Therefore, comparative analysis of kinetic variables that occur in each step depending on distance is an important factor in enhancing the consistency of the swing.
Kinetic factors that influence the accuracy of the swing include time interval, cocking the wrist, clubhead positioning and change in speed, maximizing the X-factor in backswing and ground reaction force (GRF), which is responsible for change in the center of the body. However, golf is a sport of individualized movement that requires a high level of coordination, and clear differences exist among individuals (Nesbit & Serrano, 2005). Because the swing is produced by a balance of proper mechanical techniques and effi- cient movement appropriate for each individual is needed (Davies, 1995), there is a limitation in applying the results obtained from a group of specific subjects to a general population.
Weight shift is essential for effective delivery of momen- tum in golf swing. Appropriate weight should be shifted to produce relatively large GRFs to maximize the distance of all golf shots (Hume, Keogh, & Reid, 2005). Correct weight shift is an essential factor for good swing (Sung, 2010). The swing pattern and clubhead orbit may change based on the weight shift-dependent interaction between the foot and the ground (Son, Yang, & Lee, 2009). In addition, an effective and appropriate weight shift maintains good balance, naturally rotates the upper body, and delivers maximum momentum to the golf ball (Zumerchik, 2002). Another important kinetic factor for an effective golf swing is the X-factor. The X-factor is described as the rotational angle of the shoulder relative to the pelvis. The more ex- perienced the player, the larger the value of the X-factor. A relatively large X-factor is known to be effective at increasing the speed of the clubhead at the top of the backswing (Cheetham, Martin, Mottram, & Laurent, 2001). The interaction among these kinetic factors is important for golf approach shot. However, past international and domestic studies have focused more on ways to increase the distance, and laboratory studies are mainly being con- ducted (Coleman & Rankin, 2005; Mayers et al., 2008). In cases of golf with a tendency for mental training, several limitations are seen with laboratory studies.
In this study, we created a golf course environment in a large gym. Play score was determined within 100 yards (91.44 m), and an evidence-based putting distance of 8 ft was created (Won, 2002). Approach swing was performed at 30 m, 50 m, and 70 m. Through the analysis of data, we investigated the kinetic factors affecting the control of approach shot distance and presented quantifiable data that could be used as a standard for an accurate approach shot.
1. Subjects
Subjects in this study include eight professional right-handed golf players from the KPGA, and their character- istics are presented in Table 1.
|
Subject |
Age |
Height |
Weight |
Carry |
|
S1 |
36 |
1.67 |
69 |
21 |
|
S2 |
21 |
1.73 |
57 |
10 |
|
S3 |
32 |
1.82 |
75 |
10 |
|
S4 |
29 |
1.80 |
83 |
10 |
|
S5 |
28 |
1.76 |
67 |
10 |
|
S6 |
35 |
1.83 |
75 |
19 |
|
S7 |
20 |
1.78 |
84 |
11 |
|
S8 |
29 |
1.75 |
81 |
12 |
|
M ± SD |
28.75±5.84 |
1.76±.05 |
73.87±9.21 |
12.87±4.48 |
2. Experiment equipment
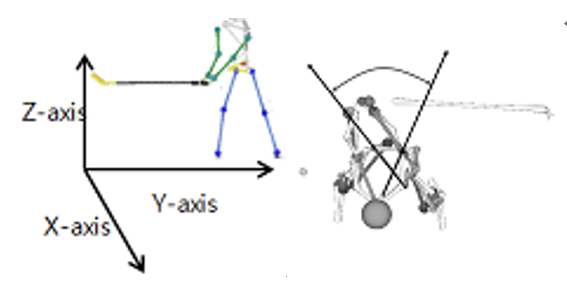
Six high-definition video cameras (Motion Master 200) were used to capture approach shots. The exposure time was set at 1/500 sec, and the speed of the camera was set at 200 frames (200 Hz) per second. A total of six cameras were used. Sets of two cameras were positioned 1.5 m from both sides, 2 m diagonally from both fronts, and 2 m diagonally from the back. Two GRF devices (AMTI ORG-6, AMTI) at 2,000 Hz collected GRFs. The GRF device can calculate the summation of x, y, and z-axis components. The anteroposterior, left, and perpendicular directions were set as the X, Y, and Z axes, respectively, which are all relative to the subjects in this study. The 3-dimensionally rotated angle was projected onto the X-Y plane and then rotated counterclockwise (+) relative to the target direction (Figure 1).
3. Experimental procedure
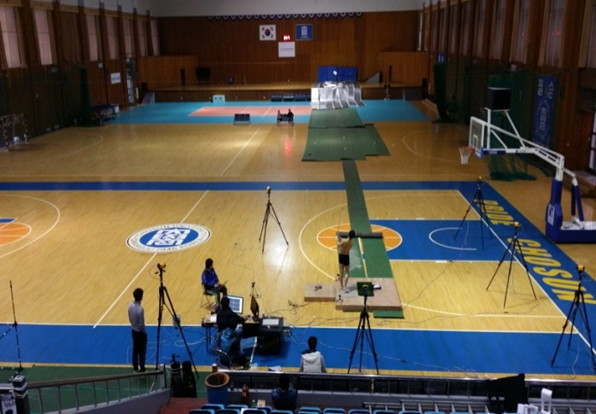
This experiment was performed in the gym of C University. This gym (Figure 2) measures 90 m in length and 50 m in height, which makes it a suitable place for conducting this experiment. To prevent injury, all subjects in this study participated in a 3-min warm-up period, in- cluding the swing. Once the subject was ready, the experi- ment was performed with the 56-degree sand wedge used during the warm-up period. For data analysis, approach shots that placed the ball into a circle of 8-ft diameter from distances of 30 m, 50 m, and 70 m were considered a success. Two shots from each distance, a total of 6 shots, were allowed.
4. Data processing
In image analysis, 3-dimensional coordinates were cal- culated with the direct linear transformation method by Abdel-Aziz & Karara (1971) using the center of the control points and the center of body joints. Low pass filter and smoothing were performed to eliminate the noise, and the cut-off frequency was set at 20 Hz (Lee, Kwon, & Lim, 2015). Kwon3D XP program was used for smoothing.
5. Events and factor analysis
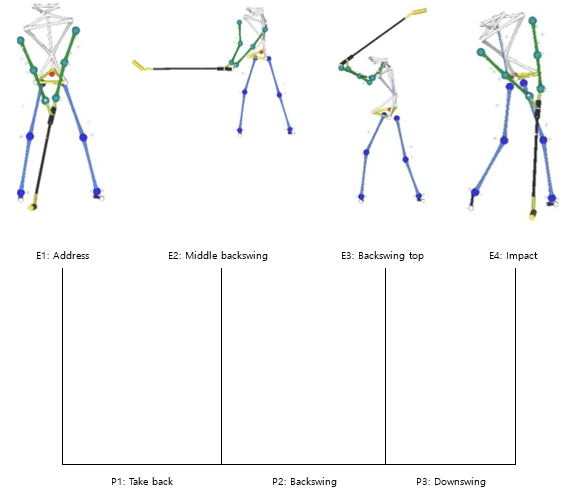
In this study, four events and three phases were set. Events 1 (E1), 2 (E2), 3 (E3), and 4 (E4) refer to address, middle backswing, backswing top, and impact, respectively. P1, P2, and P3 refer to take back, backswing, downswing phases, respectively. These are described in (Figure 3).
6. Statistical analysis
Repeat one-way ANOVA was performed using the SPSS 20.0 statistical program to test the distance-dependent differences in golf approach shots. At this time, comparison tests were performed for statistical significance, and signifi- cance level was set at p < .05.
1. Analysis of kinematic variables
The result of kinematic variables in approach swings based on changes in distance is shown in (Table 2).
As seen in (Table 2), the duration of P1 was .40±.02 sec, .38±.04 sec, and .35±.03 sec at 30 m, 50 m, and 70 m, respectively. This was statistically significant (F = 5.539, p < .05), and the results showed that 30 m resulted in a longer duration than 70 m. The duration of P2 was .25±.03 sec, .25±.04 sec, and .31±.04 sec at 30 m, 50 m, and 70 m, respectively. There was a statistically significant differ- ence (F = 6.108, p < .05), and the results showed that 30-m and 50-m distances required a shorter duration than 70 m. During the address event, the stance width (Y) was meas- ured from the left big toe to the right big toe. The stance width was .34±.02 m, .35±.03 m, and .38±.02 m at 30 m, 50 m, and 70 m, respectively. Differences were statistically significant (F = 5.588, p < .05), and 70 m had a wider stance measurement than 30 m and 50 m.
For clubhead displacement, the anteroposterior displace- ment in P2 was .32±.09 m, .40±.07 m, and .45±.07 m at 30 m, 50 m, and 70 m, respectively. Differences were statistically significant (F = 5.576, p < .01), and the results showed that 30 m had a shorter displacement than 70 m. The left-to-right displacement in P2 was .19±.09 m, .42± .22 m, and .74±.19 m at 30 m, 50 m, and 70 m, respec- tively. Differences were statistically significant (F = 22.179, p < .05), and the results demonstrated that 30 m had a shorter displacement than 50 m, and 50 m had a shorter displacement than 70 m. The left-to-right displacement in P3 was .90±.16 m, .68±.26 m, and .39±.25 m at 30 m, 50 m, and 70 m, respectively. Differences were statistically significant (F = 11.334, p < .05), and the results showed that 30 m had a longer displacement than 50 m, and both 30 m and 50 m had a longer displacement than 70 m.
The perpendicular displacement in P2 was .70±.16 m, .90±.22 m, and 1.09±.10 m at 30 m, 50 m, and 70 m, respec- tively. The difference was statistically significant (F = 12.224, p < .05), and the results showed that 30 m had a shorter displacement than 70 m. The perpendicular displacement in P3 was 1.45±.15 m, 1.62±.18 m, and 1.80±.09 m at 30 m, 50 m, and 70 m, respectively. The difference was statistically significant (F = 14.560, p < .05), and the results showed that 30 m had a shorter displacement than 50 m, and 50 m had a shorter displacement than 70 m.
|
Variable |
Event |
Factor (m) |
F |
Post- |
|||
|
30 |
50 |
70 |
|||||
|
Time (s) |
P1 |
.40 |
.38 |
.35 |
5.359* |
30 > 70 |
|
|
P2 |
.25 |
.25 |
.31 |
6.108** |
70 > 30, |
||
|
P3 |
.28 |
.27 |
.27 |
.141 |
|
||
|
Stance (m) |
E1 |
.34 |
.35 |
.38 |
5.855*** |
70 > 50, |
|
|
Clubhead (m) |
X |
P1 |
.45 |
.45 |
.40 |
1.080 |
- |
|
P2 |
.32 |
.40 |
.45 |
5.576** |
30 < 70 |
||
|
P3 |
.76 |
.82 |
.88 |
2.746 |
- |
||
|
Y |
P1 |
1.01 |
1.04 |
1.07 |
1.418 |
|
|
|
P2 |
.19 |
.42 |
.74 |
22.179*** |
50 > 30 70 > 50 |
||
|
P3 |
.90 |
.68 |
.39 |
11.334*** |
30, |
||
|
Z |
P1 |
.76 |
.77 |
.77 |
.023 |
|
|
|
P2 |
.70 |
.90 |
1.09 |
12.224*** |
30 < 70 |
||
|
P3 |
1.45 |
1.62 |
1.80 |
14.560*** |
30 < 50 50 < 70 |
||
|
Club speed (m/sec) |
E1 |
.78 |
.34 |
.42 |
1.380 |
- |
|
|
E2 |
5.58 |
6.61 |
7.61 |
31.460*** |
30 < 50 50 < 70 |
||
|
E3 |
.38 |
.66 |
.65 |
2.771 |
- |
||
|
E4 |
14.24 |
16.19 |
19.27 |
36.345*** |
30 < 50 50 < 70 |
||
|
X-factor (°) |
E3 |
36.91 |
41.42 |
45.06 |
1.946 |
- |
|
|
Cocking (°) |
E1 |
154.24 |
154.7 |
154.18 |
.144 |
- |
|
|
E2 |
154.11 |
155.95 |
156.60 |
4.145* |
70 > 50 |
||
|
E3 |
149.40 |
150.79 |
150.10 |
.921 |
- |
||
|
E4 |
155.32 |
156.36 |
154.94 |
.834 |
- |
||
The club speed in E2 was 5.58±.51 m/sec, 6.61±.80 m/ sec, and 7.61±.23 m/sec at 30 m, 50 m, and 70 m, respec- tively. Differences were statistically significant (F = 31.460, p < .001), and the results showed that 50 m had a faster speed than 30 m, and 70 m had a faster speed than 50 m. The club speed in E4 was 14.24±.77 m/sec, 16.19±2.01 m/sec, and 19.27±.73 m/sec at 30 m, 50 m, and 70 m, respectively. Differences were statistically significant (F = 36.345, p < .001), and the results displayed that 50 m had a faster speed than 30 m, and 70 m had a faster speed than 50 m.
The X-factor during backswing (E3) was 36.91±9.62°, 41.42±9.66°, and 45.06±7.73° at 30 m, 50 m, and 70 m. There was no statistically significant difference.
The cocking angle in E2 was 154.11±2.44°, 155.95±1.56° and 156.60±1.77° at 30 m, 50 m, and 70 m. Differences were statistically significant (F = 4.145, p < .05), and the results showed that 70 m had a greater degree of cocking angle than 50 m.
2. Differences in ground reaction forces
Differences in distance-dependent GRFs during approach swing are shown in (Table 3).
As seen in (Table 3), the right side anteroposterior GRFs in E2 were .29±.07 N/kg, .40±.09 N/kg, and .52±.24 N/kg at 30 m, 50 m, and 70 m, respectively. The differences were statistically significant (F = 5.042, p < .05), and the results showed that 30 m had a smaller GRF than 70 m. The right anteroposterior GRF in E3 was .35±.08 N/kg, .32±.23 N/kg, and .68±.21 N/kg at 30 m, 50 m, and 70 m, respectively. The differences were statistically significant (F = 10.336, p < .05), with a smaller GRF reported in 30 m and 50 m than in 70 m.
The left side GRF in E1 was .32±.03 N/kg, .38±.10 N/kg, and .46±.09 N/kg at 30 m, 50 m, and 70 m, respectively. The differences were statistically significant (F = 6.438, p < .05), and the results showed that 30 m had a smaller GRF than70 m. The right side left-to-right GRF in E1 was .18±.19 N/kg, .31±.19 N/kg, and .44±.19 N/kg at 30 m, 50 m, and 70 m, respectively. Differences were statistically significant (F = 4.425, p < .05), and the results showed that 30 m had a smaller GRF than 70 m.
|
Axis |
Event and |
Factor (m) |
F |
Post- |
|||
|
30 |
50 |
70 |
|||||
|
X-axis (N/kg) |
Right |
E1 |
.21 |
.38 |
.37 |
2.242 |
- |
|
E2 |
.29 |
.40 |
.52 |
5.042* |
70 > 30 |
||
|
E3 |
.35 |
.32 |
.68 |
10.336** |
70 > 30, |
||
|
E4 |
.54 |
.68 |
.54 |
.613 |
- |
||
|
Left |
E1 |
.32 |
.38 |
.46 |
6.438** |
70 > 30 |
|
|
E2 |
.22 |
.31 |
.36 |
1.105 |
- |
||
|
E3 |
.13 |
.14 |
.19 |
.144 |
- |
||
|
E4 |
.48 |
.22 |
.40 |
2.092 |
- |
||
|
Axis |
Event and |
Factor (m) |
F |
Post- |
|||
|
30 |
50 |
70 |
|||||
|
Y-axis (N/kg) |
Right |
E1 |
.18 |
.31 |
.44 |
4.245* |
70 > 30 |
|
E2 |
.32 |
.25 |
.33 |
.143 |
- |
||
|
E3 |
.05 |
-.15 |
-.42 |
2.564 |
- |
||
|
E4 |
-.21 |
-.83 |
-.53 |
2.437 |
- |
||
|
Left |
E1 |
.29 |
.26 |
.35 |
.475 |
- |
|
|
E2 |
.43 |
-.12 |
.27 |
2.411 |
- |
||
|
E3 |
.10 |
-.14 |
-.46 |
3.522* |
70 > 30 |
||
|
E4 |
-.08 |
-.51 |
-.91 |
4.262* |
70 > 30 |
||
|
Z-axis (N/kg) |
Right |
E1 |
4.66 |
5.08 |
5.53 |
3.176 |
|
|
E2 |
5.14 |
5.35 |
5.96 |
1.099 |
|
||
|
E3 |
4.78 |
4.17 |
5.7 |
4.452* |
70 > 50 |
||
|
E4 |
4.77 |
4.66 |
3.53 |
2.588 |
|
||
|
Left |
E1 |
4.77 |
4.44 |
4.87 |
1.743 |
|
|
|
E2 |
4.31 |
4.09 |
5.36 |
1.726 |
|
||
|
E3 |
4.15 |
4.06 |
5.60 |
3.541* |
70 > 50 |
||
|
E4 |
6.45 |
5.77 |
6.59 |
.310 |
|
||
The left side left-to-right GRF in E3 was .10±.39 N/ kg, -.14±.34 N/kg, and -.46±.60 N/kg at 30 m, 50 m, and 70 m, respectively. The differences were statistically signifi- cant (F = 3.522, p < .05), and 30 m had a smaller GRF compared with 70 m. The left side left-to-right GRF in E4 was -.08±.43 N/kg, -.51±.71 N/kg, and -.91± .61 N/kg at 30 m, 50 m, and 70 m, respectively. The differences were statistically significant (F = 3.522, p < .05), and the results showed that 30 m had a smaller GRF than 70 m.
The right side perpendicular GRF in E3 was 4.78±1.02 N/kg, 4.17±1.39 N/kg, and 5.7±0.94 N/kg at 30 m, 50 m, and 70 m, respectively. The differences were statistically significant (F = 4.452, P < .05), and the results showed that 50 m had a smaller GRF than 70 m. The left side per-pendicular GRF in E3 was 4.15±.63 N/kg, 4.06±.97 N/kg, and 5.60±.13 N/kg at 30 m, 50 m, and 70 m, respectively. The differences were statistically significant (F = 3.541, p < .05), and the results showed that 50 m had a larger GRF than 70 m.
3. Correlation between each variable
We analyzed the correlation among variables influencing the club speed as it was previously shown that there is a statistically significant difference in the clubhead speed depending on distance. This is shown in (Table 4).
As shown in , there was a significantly positive association (+) between stance width and clubhead dis- placement. Other variables did not have any significant correlation with clubhead speed. A significant correlation was seen with stance width (.587, p < .01), clubhead dis- placement X (.454, p < .05), clubhead displacement Y (.691, p < .01), and clubhead displacement Z (.721, p < .01). The correlation demonstrated that the wider the stance width and the larger the clubhead displacement, the higher the clubhead speed.
|
Variable |
Stance |
Time (P3) |
Clubhead
displacement |
Clubhead
displacement |
Clubhead
displacement |
X-factor |
Cocking (E3) |
Cocking (E4) |
|
Club
speed |
.587** |
.187 |
.454* |
.691** |
.721** |
.156 |
.109 |
.089 |
In golf, rhythm refers to the time flow from address to finish. However, change in the time flow occurs depending on the characteristic of each phase. Typically, backswing phase is of a long duration, and downswing phase is of a short duration. The long duration of backswing is to create the correct trajectory and accumulate energy. In this study, the duration was different in P1 and P2; 30 m had long duration in the take back phase and 70 m in the back-swing phase. In the downswing phase P3, there was no difference in the total time. These characteristics may be discussed with the clubhead position changes. The left-to-right clubhead displacement was relatively large at 70 m with short duration, which may be interpreted as a quick take back. Thus, with an increased distance, the take back duration reduces and the swing takes longer. Jung (2011) reported the opposite where increasing the take back dis- tance yielded increased duration and total time. In addition, Son (2010) investigated the differences in duration according to distance control using sand wedge, and the results showed that increasing the distance between the address and the backswing top led to a longer duration. These contrasting results in past studies are probably owing to swings based on individual control, rather than swings performed at a predetermined distance as in our present study. This demonstrates that the backswing phase is an important factor in controlling the distance of approach shots. Table 4. Correlation between club speed and biomechanics variable Variable Stance width Time (P3) Clubhead displacement (X) Clubhead displacement (Y) Clubhead displacement (Z) X-factor Cocking angle (E3) Cocking angle (E4) Club speed .587** .187 .454* .691** .721** .156 .109 .089 **p < .01, *p < .05 Stance width of the address or the starting position for executing a golf swing is important for safety. Experienced golf players try to maintain consistency of the swing by widening the stance (Moon, 2004). Hume, Keogh, & Reid reported that the most appropriate stance is to have the distance between the heels of both feet not exceed the width of the shoulder with the number 5 iron as the center. The most appropriate width of the stance may change depending on the type of the club, but majority is within 5 cm. In this study, there was a statistically significant dif- ference based on distance, but the stance width a range of 4 cm supports the results presented by Hume, Keogh, & Reid (2005).
In approach swing, the position of clubhead changes with distance. As the distance increases, the swing tra-jectory increases to send the ball further away. In this study, the right-to-left displacement in P2 was highest at 70 m and at 30 m in P3. Perpendicular displacement in P2 and P3 was highest at 70 m. Professional golf players commonly change the clubhead position to alter the dis- tance during approach swing. The clubhead is positioned relatively close to the body from the take back phase to the backswing top phase (P2), which lengthens the swing from the left-to-right position to the backswing top position. At the same time, a greater perpendicular displacement is produced from the take back phase. This result is possible due to the use of swing size to control the distance, not the strength of the swing.
During golf swing, cocking of the left wrist increases the speed of the clubhead, and the delayed release of the cocked wrist increases the flying distance (Son & Choi, 2012; Budney & Bellow, 1982). Moon (2004) showed that minimizing the variation in cocking angle during the address and impact phase is the most effective t in driver swing and in producing consistent swing movement. In this study, no significant difference was found with cocking angle at different distances in all phases except E2. When comparing this study to other similar studies (Son, 2012; Jung, 2011), contrasting results are seen. Jung (2011) compared profes- sional golf players and amateur players. Jung showed that there is no significant difference between the two groups of players based on distance during impact phase. Son (2012) reported that a significant difference was observed with cocking angle at different distances during approach swing. This contrasting result between two studies is due to a difference in study design. In the study by Son (2012), a 4-fold difference was reported, but it was within standard deviation. In our study, there was no significant difference in angular deviation between the address and impact points. Similar to the study by Moon (2004), we agree that minimizing the distance between the address and impact points is most effective, confirming such prin- ciple is also required in this study through sand wedge.
Jang (2005) reported that the X-factor is an important kinetic factor for enhancement of golf performance for amateur players. The X-factor may influence the clubhead speed and flying distance in novice golf players, but it is not an influential kinetic factor in professional players.
Upon such contradicting results, this study analyzed the change in X-factor during approach swing, where accuracy is considered to be more important than the increase in flying distance. In the backswing top phase, a 4- to 5-fold increase in the X-factor was observed without statistical significance. Son (2012) presented that there was a signifi- cant difference depending on distance in the backswing phase, which is a contrasting result to our results. Our results showed that 70 m had a 10-fold increase in the X-factor compared with 30 m. The study by Son (2012) also showed that the difference between 30 m and 70 m was near 10-fold, which is similar to our result. Thus, the contrasting result can be explained by a difference in the basis for statistical significance between the two studies. Therefore, the result is due to individual differences of each subject, and our study’s difference of ±9 supports this prediction.
Through correlation analysis, we investigated the variables affecting the clubhead speed based on distance.
In golf swing, the linear and rotational motions of the body from the address to backswing contribute to more than 60% of the clubhead movement (Choi, Kim, & Kwon, 2014). In other words, it can be predicted that the X-factor has an influence on the clubhead speed. However, no statistically significant correlation was observed between the clubhead speed and X-factor in this study. This result is similar to that of Jang (2005), where it was reported that the X-factor does not significantly affect the flying distance in professional golf players. Since our study subjects were professional golf players, we predict that the X-factor is not an influential variable. However, a positive correlation was seen between the stance width and the clubhead displacement.
The correlation between the clubhead speed and stance width is probably due to subjects taking an address position with wide stance to target a long shot. This supports that a stable stance is needed for the clubhead speed. In addition, the clubhead displacement can be correlated to duration. Distance may be controlled by altering the position of the clubhead, in other words, by adjusting the size of the swing.
Unlike driver swing (Kim, 2010), approach swing requires gravity-dependent smooth swing based on swing trajec- tory instead of the X-factor. A short approach shot seen in the study by Leadbetter & Smith (2006) necessitates body rhythm more than delivery of force.
Typical golf swing theory emphasizes the importance of appropriate weight shift for good swing. Leadbetter & Smith (2006) showed that body rhythm is important in short approach shot as well. A swing by arm and shoulder movement alone without weight shift is reported as simple but more likely to go wrong due to rigid arm movement (Sung, 2007). In this study, distance-dependent anteropos- terior, left-to-right, and perpendicular GRFs were divided based on weight and was analyzed. Differences depending on distance were observed in right foot E2 and E3, as well as in left foot E1. In the address position, weight was shifted toward the soles of the left foot to increase the distance by creating a repulsive force on the left foot. In contrast, the right foot GRF was increased in the front of the right foot during the middle backswing phase and the backswing top phase. Similar to our study, Woo et al. (2008) reported that the right foot's anteroposterior GRF largely increases with an increase in approach shot distance.
The left-to-right GRF is the same as swing trajectory and (-) represents the swing direction to the right and (+) represents the direction to the left. Sung (2007) reported that displacement of backswing lengthens proportional to an increase in the target distance. The reaction force in- creases from the right foot towards the target to prevent the body from being pulled toward the right side due to increased backswing. In our study, there was no significant difference in the right foot left-to-right GRF in the E3 phase. The left GRF increased in the (-) direction depending on distance. This is because the center collapses when the weight is shifted toward the outer edge of the left foot in the backswing top phase. The force of the left foot in- creases with distance because the size of the backswing top increases.
Perpendicular GRF can predict changes in the center of the body, which is essential for accuracy of approach shot (Fujimoto, 1995). In the E3 phase in this study, the reaction force on the right side during backswing top increased depending on the distance, and the reaction force on the left increased as well. Kim et al. (2007) reported that the reaction force of the right foot increased depending on the target distance, and Woo et al. (2008) showed that the reaction force of the right foot increased with an increase in the target distance. However, Hume, Keogh, & Reid (2005) reported that the left foot GRF at the impact phase increased with an increase in the approach shot distance. They also reported that shifting the weight toward the target increases the speed of the clubhead. Park, Youm, Seo, & Seo (2007) presented that weight shift during golf swing may yield variable results from the scientific analysis, and thus, must be interpreted with caution. Therefore, we propose that results from a large-population study are needed to generalize the above results.
Kinematic analysis presenting quantitative data is useful to understand the mechanism of golf swing. Therefore, the purpose of this study was to analyze kinetic factors at different distances during approach swings performed by professional golf players and provide basic data to improve the performance of golf players. There were 8 KPGA-associated professional golf players, and approach swings were performed at 30 m, 50 m, and 70 m. Kinetic factors were collected by six infrared cameras and a GRF device. EMG data were calculated with Kwon3D XP and Myo- research. The calculated data were subjected to repeat one-way ANOVA using the SPSS 20.0. All significant levels were set with a p value of 0.05. The following results were obtained from comparative analysis of the data.
First, in approach swing, a statistically significant differ- ence was observed in duration time, stance width, club- head displacement, clubhead speed, and cocking angle, depending on distance.
Second, in approach swing, a statistically significant dif- ference was observed in GRFs, depending on distance. In anteroposterior displacement, a significant difference was observed in all phases, excluding the impact phase. In left¬to-right displacement, no significant difference was observed in the take back phase. In perpendicular displacement, there a significant difference was found in the backswing top phase.
In summary, professional golf players obtained various results regarding kinetic factors during approach swing at different distances. We present that distance control with the size of swing rather than the acceleration of the swing is the most important mechanism in maintaining accuracy and consistency of golf swing.
References
1. Abdel-Aziz, Y. L. & Karara, H. M. (1971). Direct Linear Trans- formation From Comparator Coordinates in Object-Space Coordinates in Close-Range Photogrammetry. Proceedings of the ASP Symposium of Close-Range Photogrammetry. Urbana, IL.
Crossref
Google Scholar
2. Choi, I. A., Kim, E. J. & Kwon, M. S. (2014). The Effect of Difference of Ground Slope on the Swing Plane and X-factor Motion during the Golf Swing. Korean journal of physical eduaction, 53(1), 431-440.
Crossref
3. Coleman, S. G. S. & Rankin, A. J. (2005). A three-dimensional examination of the planar nature of the golf swing. Journal of Sports Sciences, 23, 227-234.
Crossref
Google Scholar
PubMed
4. Ford, K. R,. Myer, G. D. & Hewett, T. E. (2003). Valgus knee motion during landing in high school female and male basketball players. Medicine Science and Sports in Exercise, 35(10), 1745-1750.
Crossref
Google Scholar
5. Hume, P. A., Keogh, J. & Reid, D. (2005). The role of bio-mechanics in maximising distance and accuracy of golf shots. Sports medicine, 35(5), 429-449.
Crossref
Google Scholar
PubMed
6. Hume, P. A., Keogh, J. & Reid, D. (2005). Biomechanics in Maximizing distance and accuracy of golf shots. Sports Medicine, 35(5), 459-449.
Crossref
Google Scholar
PubMed
7. Jang, J. K. (2005). The effect of X-Factor in club head speed. Korean journal of physical eduaction, 44(4), 431-438.
Crossref
Google Scholar
8. Jung, S, E. (2011). Biomecanical Factor Analysis of Distance Adjustment during the approach Shot within 100Yards between Professional and Amateur Golfers, Unpub- lished doctoral dissertation, Unpublished Master's thesis, Graduate School of Soonchunhyang University.
Crossref
9. Kim S. Y., Lee J. S., Yang J. O., Rhee S. D., Kim Y. S., Lee B. J. & Kim I. H.(2009). Gender differences in Electromyo- graphy of the Lower Extremity during Golf Driver Swing. Korean Journal of Sport Biomechanics. 19(3), 557-566.
Crossref
Google Scholar
10. Kim, H. M., Woo, S. Y. & Jung, S. E. (2007). Kinematic Factors Influencing on the Precision of Short Approach Shoots in Golf. Korean Journal of Sport Biomechanics, 17(2), 227-237.
Crossref
Google Scholar
11. Kim, J. J. (2007). Kinematic Analysis of 20 m Approach Motion by Golf Open Stance Angle Changes, Unpub- lished Master's Thesis dissertation, Graduate School of konkuk University.
Crossref
Google Scholar
12. Kim, K. J. (2008). A comparative analysis of IEMG of skilled hands and beginners of golf on the frequent injuring areas from Iron shot, Korean Journal of Exercise science, 17(1), 95-104.
Crossref
Google Scholar
13. Kim, Y. S. (2010). Analysis of Pelvis movement, Triple X-Factor, and O-Factor During a Golf Driver Swing. Gra- duate School of Kookmin University.
Crossref
Google Scholar
14. Leadbetter, D. & Smith, S. (2006). Leadbetter's Quick Tips: the very best short lessons to fix any part of your game. New York, NY:Doubleday.
Crossref
Google Scholar
15. Lee K. I, Ryu M. S. & Hong W. K. (2015). Analysis on Differences in Muscle Distance Changes and Success of Failure in Connection with golf Approach Swings, Korean Journal of Sport Biomechanics, 25(1), 21-28.
Crossref
Google Scholar
16. Lee, K. H., Kwon, M. Seok. & Lim, Y. T. (2015). Correlation Analysis of The X-Factor, X-Factor Stretch and Swing-Related Factors during Drive Swing. Korean Journal of Sport Biomechanics, 125(2), 149-155.
Crossref
Google Scholar
17. Mayers, J., Lephart, S., Tsai, Y. S., Sell, T., Smoliga, J. & Jolly, J. (2008). The role of upper torso and pelvis rotation in driving performance during the golf swing. Journal of Sports Sciences, 26(2), 181-188.
Crossref
Google Scholar
18. Moon, B. I. (2004). Analysis of Kinematic and Kinetic Char- acteristics During the Golf Swing, Unpublished doctoral dissertation, Graduate School of Chosun University.
Crossref
19. Park, Y. H., Youm, C. H., Seo, K. W. & Seo, K. E. (2007). Number of trials for the reliable golf swing ground reaction force data collection and its characteristics, Korean Journal of Sport Biomechanics, 17(4), 115-125.
Crossref
Google Scholar
20. Son, D. J., Yang, J. O. & Lee, J. S. (2009). Influence of Dif- ferent Slope Analysis during Pitching Wedge Swing on Plantar Pressure Distribution Pattern. Korean Journal of Sport Biomechanics, 19(2), 297-309.
Crossref
Google Scholar
21. Son, J. H. (2012). Analysis of golf players' swing motion according to adjustment of power, distance and traj- ectory, Unpublished doctoral dissertation, Graduate School of Kookmin University.
Crossref
Google Scholar
22. Son, J. H. & Choi, H. J. (2012). The Identification of Opti- mized Factors to Distance by Sand-wedge Shot in Golf. Journal of Sport and Leisure Studies, 49, 821-830.
Crossref
23. Sung, N. J. (2007). Changes of Ground Reaction Forces by the Change of Club Length in Golf Swing. Korean Journal of Sport Biomechanics, 17(2), 31-40.
Crossref
Google Scholar
24. Sung, N. J. (2010). A Method for Analyzing and Evaluating the Golf Swing Using the Force Platform Data. Korean Journal of Sport Biomechanics, 20(2), 213-219.
Crossref
Google Scholar
25. Won, H, J. (2002). Davepelz's short game bible. Seoul; Hak- WonSa.
Crossref
26. Woo, S. H., Kim, H. M. & Seo, S. H. (2008). Change of the Center of Body Gravity according to the Target Distance of Professional Golfer's Short Approach Shots. Journal of Sport and Leisure Studies, 34, 1367-1374.
Crossref
