Open Access, Peer-reviewed
eISSN 2093-9752
Open Access, Peer-reviewed
eISSN 2093-9752
Cheol-Hee Park
Young-Kwan Kim
Chang-Yei Back
http://dx.doi.org/10.5103/KJSB.2016.26.1.71 Epub 2016 April 20
Abstract
Objective: The purpose of this study was to investigate kinematic comparisons of Tsukahara vault in gymnastics between a top-level athlete and sublevel collegiate athletes in order to obtain information on key biomechanical points for successful Tsukahara vaults.
Methods: An Olympic gold medalist (height, 160 cm; weight, 52 kg; age, 25 years) and five sublevel collegiate gymnasts (height, 168.2 ± 3.4 cm; weight, 59.6 ± 3.1 kg; age, 23.2 ± 1.6 years) participated in this study. They repeatedly performed Tsukahara vaults including one somersault. Fourteen motion-capturing cameras were used to collect the trajectories of 26 body markers during Tsukahara vaults. Event time, displacement and velocity of the center of mass, joint angles, the distance between the two hands on the horse, and averaged horizontal and vertical impact forces were calculated and compared.
Results: The top-level athlete showed a larger range of motion (ROM) of the hip and knee joints compared to sublevel collegiate athletes during board contact. During horse contact, the top-level athlete had a narrow distance between the two hands with extended elbows and shoulders in order to produce a strong blocking force from the horse with a shorter contact time. At the moment of horse take-off, reactive hip extension of the top-level athlete enhanced propulsive take-off velocity and hip posture during post-flight phase.
Conclusion: Even though a high velocity of the center of mass is important, the posture and interactive action during horse contact is crucial to post-flight performance and the advanced performance of Tsukahara vaults.
Keywords
Tsukahara vault Gymnastics Kinematics
The vault, an artistic gymnastics skill, is one of the major medal events in the Olympic Games for South Korea. Jong Hoon Park won the first bronze medal in the Seoul Olympic Games in 1988, and Ok Ryul Yoo and Hong Chul Yeo won a bronze medal in the Barcelona Olympic Games in 1992 and a silver medal in the Atlanta Olympic Games in 1996, respectively. In addition, Hak Seon Yang developed a new technique (YANG Hak Seon, difficulty score 7.4 [cur- rently 6.4]) and successfully performed it in the London Olympic Games in 2012, resulting in a gold medal. This has improved South Korea's international standing in vault events. Continuous efforts have been made by athletes, coaching staff, and sports scientists to enhance perform- ance, enabling the new technique to be developed and improved, which has resulted in top-level achievements. According to recent changes in the gymnastics rules, all athletes must demonstrate 2 different techniques in competition. The International Federation of Gymnastics (Federation Internationale de Gymnastique, 2013) has de- cided that athletes must perform 2 different kinds of vault motions from different groups (EG-I to EG-V) in prelim- inary rounds and final rounds, respectively. Among the different technique groups, the favorite one for Korean men is the Tsukahara type (Group IV) (Yeo, 2003). Recently, in order to enhance their chances of winning medals, they have also often used the handspring type (Group III) pre- ferred by western athletes. The Tsukahara vault is com- posed of board take-off, sideways hands touch down on the horse, and stretched take-off with a backward salto, during which a technical difficulty score depends on the number of twist rotations in the air (Lee, Back, Kim, & Kong, 2005). In contrast, the handspring technique is com- posed of motions with a forward approach and both hands touch-down on the horse simultaneously, which is bene- ficial in obtaining greater heights and also in generating sagittal rotation, enabling various techniques to be applied. The Tsukahara technique induces reverse torque in the horse contact phase, so it is advantageous for producing twist moment of the body (Park & Kim, 2014).
To date, research on gymnastic vaulting has revealed strategic factors that enhance the post-flight time and facilitate advanced techniques. It has already been re- ported that a fast horizontal velocity in the approach run to the horse is essential for reaching a high vertical velocity in post-flight (Park & Song, 2012; Lim, 2004; Takei, 1988, 1989, 1996, 1998, 2007; Yeadon, King, & Springings, 1998), and it was also revealed that it is critical to generate a vertical component of propulsion for successful perform- ance through a strong blocking at horse contact in order to obtain vertical velocity effectively (Lee, Park, & Lee, 2006; Lee, Song, & Park, 2012). At the moment of horse contact, elbow and shoulder joints should not be flexed, and the center of mass should not be displaced forward in the direction of movement (Yeo, 2006).
Among studies on the vault, however, only a few studies have focused on basic motions using the new type of vaulting table. Early studies on basic motions were con- ducted with the old type of vaulting table, and recent studies using the new type of vaulting table have only dealt with the application of highly advanced motion analysis. Thus, the results of early studies on basic motions are inappropriate to current training situations where the new type of vaulting table is used. Previous papers found that it was difficult to increase take-off momentum be- cause of the sideways approaching to the horse in the Tsukahara technique, resulting in a longer horse contact time and the majority of the weight being supported by one arm (Dilman, Cheetham, & Smith, 1985; Park, Youn, Back, Kim, & Chung, 2003). However, the new vaulting table with a rounded front and wide top area for a stable touch introduced in 2001 is more beneficial for the twist of the Tsukahara type compared to other techniques (Park & Kim, 2014). In addition, it has been reported that the new type of vaulting table enables an increased take-off force from horse blocking, and the development of various post-flight techniques (Back et al., 2005).
From the perspective of the training field, it is necessary to completely master the basic Tsukahara technique in order to perform advanced Tsukahara techniques. A number of studies have shown that it is only possible to perform advanced techniques successfully when basic techniques are perfectly mastered (Lee et al., 2006). Hence, it is neces- sary to objectively evaluate the basic techniques of athletes and give correct feedback of kinematic measurements while athletes learns basic techniques.
Therefore, the present study captured basic Tsukahara techniques from athletes at different levels using the new vaulting table and conducted kinematic analyses. Through comparative analysis of kinematic factors, this study aimed to find out the strengths and weaknesses of a top-level athlete and sublevel athletes, and to identify key points of the Tsukahara vault required for performing advanced techniques. In addition, the secondary aims were to pro- vide coaches and young athletes intending to learn the Tsukahara technique for the first time with basic data to perform evidence-based training. In addition, this study specifically describes the postures of both hands at the moment of horse touch-down, which were overlooked in previous studies.
1. Study subjects
The top-level athlete (A) was YHS, a gold medalist of the vault in the 2012 London Olympic Games, who was able to perform the Tsukahara 1260°. Sublevel athletes (B) were 5 collegiate athletes who could perform a 360° twist motion in the Tsukahara. The average difficulty score (D-score) of the sublevel athletes was 4.4 points, which was lower than that of normal collegiate athletes (5.2 points). Anthropometric data and D-scores of the subjects are presented in Table 1. According to the code of research ethics, written informed consent forms were received from the participants prior to the experiment.
|
Height (cm) |
Weight (kg) |
Career (yr) |
Age (yr) |
Score (D-score) |
|
|
A |
160 |
52 |
14 |
25 |
6.4 |
|
B1 |
168 |
58 |
12 |
23 |
4.4 |
|
B2 |
172 |
64 |
12 |
23 |
4.4 |
|
B3 |
170 |
56 |
12 |
23 |
4.4 |
|
B4 |
163 |
59 |
13 |
25 |
4.4 |
|
B5 |
168 |
61 |
14 |
25 |
4.4 |
|
B |
168.2 (3.35) |
59.6 (3.05) |
12.6 (0.89) |
23.8 (1.10) |
4.4 (0.0) |
2. Study equipment
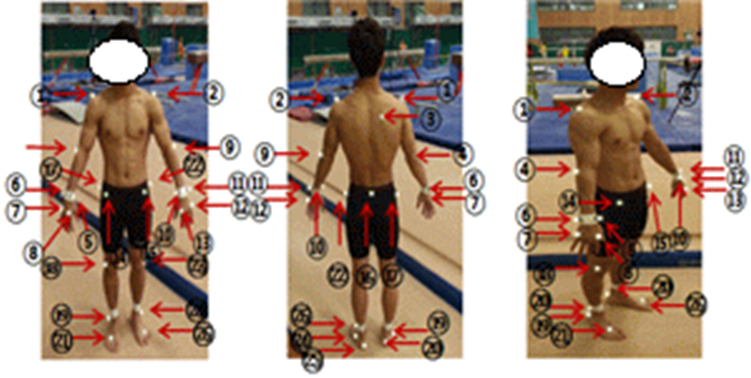
For motion measurements, 8 indoor infrared cameras (Osprey®, Motion Analysis, USA) and 6 outdoor infrared high-speed cameras (Raptor-E®, Motion Analysis, USA) were used together. Cameras were operated using manufacturer¬provided software (Cortex 4.0®, Motion Analysis, USA), in which the sampling rate was set to 200 Hz. To acquire and analyze the desired motion data, 26 19-mm reflective markers were attached to major anatomical points, in which a 15-segment body model was used (Figure 1, Table 2). A global coordinate system was set up with the forward movement direction as the X axis, the Y axis on the per- pendicular line in the horizontal plane, and the vertical direction as Z axis. Kinematic variables were calculated using Matlab® (ver. 2003, MathWorks, USA), a commercial numerical analysis program, after downloading measured positional data of 3-D markers.
3. Experimental procedure
Participants had time to warm up for long enough to become familiar with the experimental conditions for com- fortable performance. Then, reflective markers were attached to major points of the body using double-sided tape (Table 2). They were attached to the tight swimsuit and bare skin with an athletic tape to prevent them from falling off during motion.
|
Number |
Location |
|
① |
Right shoulder (acromion process) |
|
② |
Left shoulder (acromion process) |
|
③ |
Right scapular (inferior angle |
|
④ |
Right elbow (lateral epicondyle) |
|
⑤ |
Right radial styloid process |
|
⑥ |
Right ulnar styloid process |
|
⑦ |
Right 5th metacarpophalangeal joint |
|
⑧ |
Right 3nd metacarpophalangeal joint |
|
⑨ |
Left elbow (lateral epicondyle) |
|
⑩ |
Left radial styloid process |
|
⑪ |
Left ulnar styloid process |
|
⑫ |
Left 5th metacarpophalangeal joint |
|
⑬ |
Left 3nd metacarpophalangeal joint |
|
⑭ |
Right anterior superior iliac spine |
|
⑮ |
Left anterior superior iliac spine |
|
⑯ |
Middle of posterior superior iliac spine |
|
⑰ |
Right greater trochanter |
|
⑱ |
Right knee (lateral condyle) |
|
⑲ |
Right ankle (lateral malleolus) |
|
⑳ |
Right heel (calcaneus bone) |
|
㉑ |
Right toe (2nd metatarsophalangeal joint) |
|
㉒ |
Left greater trochanter |
|
㉓ |
Left knee (lateral condyle) |
|
㉔ |
Left ankle (lateral malleolus) |
|
㉕ |
Left heel (calcaneus bone) |
|
㉖ |
Left toe (2nd metatarsophalangeal joint) |
Once everything was ready, participants began to per-form the Tsukahara basic motion when given the com- mands of 'ready' and 'start' by the examiner. According to the request of the participant, the top-level athlete at tempted only 2 times, both of which showed stable land- ings. The mean values of the 2 trials were used for data processing. Each of the sublevel collegiate athletes perfor- med 5 attempts, of which the best 2 results in terms of stable landing and flight height were selected. Their mean values were used for further analysis on kinematic factors.
4. Data processing and analysis
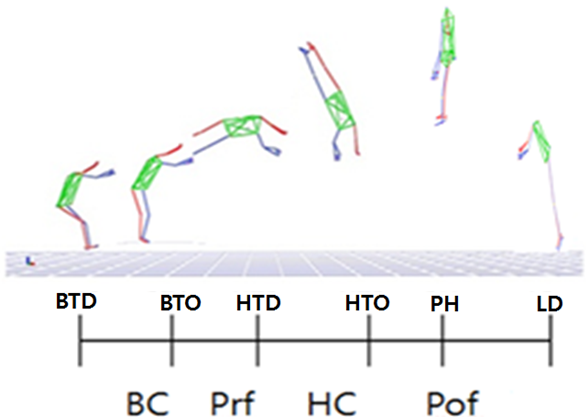
The present study defined motion events and phases as follows (Park & Kim, 2014, Figure 2): board contact (BC) phase was from board touch-down (BTD) with feet to board take-off (BTO); horse contact (HC) phase was from horse touch-down (HTD) with the left hand to horse take¬off (HTO) with the right hand; peak height (PH) was the maximum vertical height reached by the center of mass during post-flight; and landing (LD) was when the feet touched the mat. It was also defined that pre-flight was the flight phase from BTO to HTD, and post-flight phase was the duration from HTO to LD.
In addition to position and velocity of the center of mass (CM), the current study defined angular variables as follows based on preceded studies (Lee et al., 2006; Takei, Blucker, Hudert, Myers, & Fortney, 1996; Takei, 2007): shoulder angle was the relative angle between the upper arm and trunk; elbow angle was the relative angle between the forearm and the upper arm; hip angle was the relative angle between the thigh and the trunk; and knee angle was the relative angle between the lower leg and the thigh. The relative angle to the vault table was defined as the projected angle between the X axis (horizontal axis) and the vector from the center of mass of both hands to the center of mass on the XZ plane (sagittal plane), which in- cludes the landing angle and the take-off angle. In addition, the kinematic results and masses of subjects were inserted to the impulse-momentum equation ((ΣF) • (Δt)=m • ΔV, where ΣF is mean impact force, Δt is contact time, m is the mass of the subject, and ΔV is difference of velocity), by which mean horizontal and vertical impact forces gene- rated at board and horse contacts were calculated.
5. Statistical analysis
This study presented statistical results of techniques (i.e., mean and standard deviation) to investigate differences between the top-level athlete and sublevel collegiate athletes.
1. Event time and phase time of motion
Event time and phase time of the motion are presented in Table 3. Total event time was 1.34 sec for the top-level athlete (A) and 1.32 ± 0.02 sec for the sublevel athletes (B), indicating that the top-level athlete had a longer event time by 0.02 sec. In detail, while the two groups yielded the same results in the BC phase, the top-level athlete was shorter in the pre-flight (PrF) phase by 0.03 sec and in the horse contact (HC) phase by 0.03 sec. However, the top level athlete had a longer post-flight (PoF) phase by 0.09 sec than the sublevel collegiate athletes. Of the collegiate athletes, athlete B2 showed the longest pre-flight time (0.22 sec) and the same horse contact phase (0.12 sec) as that of the top-level athlete. Despite having the shortest pre-flight time (0.17 sec), athlete B4 showed the longest horse contact phase (0.18 sec).
|
BC |
PrF |
HC |
PoF |
VT |
|
|
A |
0.04 |
0.16 |
0.12 |
1.02 |
1.34 |
|
B1 |
0.04 |
0.18 |
0.16 |
0.94 |
1.32 |
|
B2 |
0.04 |
0.22 |
0.12 |
0.92 |
1.30 |
|
B3 |
0.04 |
0.21 |
0.14 |
0.94 |
1.33 |
|
B4 |
0.04 |
0.17 |
0.18 |
0.91 |
1.30 |
|
B5 |
0.03 |
0.19 |
0.16 |
0.95 |
1.33 |
|
B |
0.04 (0.00) |
0.19 (0.02) |
0.15 (0.02) |
0.93 (0.02) |
1.32 (0.02) |
2. Horizontal and vertical displacements of the center of mass
Table 4 presents the displacements of the center of mass. Both horizontal and vertical displacements were normalized to the height of the athlete. Horizontal dis- placements were expressed by changes in the position of BTD (i.e., the reference position). In horizontal displacements, the displacement of the top-level athlete (0.163 times of height) was 0.044 times farther at BTO than that of colle- giate athletes (0.119 times of height). In addition, horizontal displacement of the top-level athlete (3.138 times of height) was 0.608 times farther in landing than that of the colle- giate athletes (2.530 times of height). When horizontal distances during pre-flight and post-flight were compared, the top-level athlete was shorter in pre-flight (0.493 times of height) than the collegiate athletes (0.503 times of height). However, the top-level athlete (2.144 times of height) moved much farther in post-flight than the colle- giate athletes (1.575 times of height).
For vertical displacements, the top-level athlete and the collegiate athletes had similar results from BTO to HTO. However, the top-level athlete had much higher values in PH and LD (1.588 and 0.531 times of height, respectively) than the collegiate athletes (1.394 and 0.421 times of height, respectively).
|
BTD |
BTO |
HTD |
PrF |
HTO |
PH |
LD |
PoF |
|
|
Horizontal displacement |
||||||||
|
A |
0.0 |
0.163 |
0.656 |
0.493 |
0.994 |
1.856 |
3.138 |
2.144 |
|
B1 |
0.0 |
0.119 |
0.589 |
0.470 |
0.940 |
1.637 |
2.512 |
1.572 |
|
B2 |
0.0 |
0.110 |
0.674 |
0.564 |
0.942 |
1.593 |
2.512 |
1.570 |
|
B3 |
0.0 |
0.129 |
0.676 |
0.547 |
0.971 |
1.612 |
2.441 |
1.470 |
|
B4 |
0.0 |
0.135 |
0.583 |
0.448 |
0.982 |
1.681 |
2.663 |
1.681 |
|
B5 |
0.0 |
0.101 |
0.589 |
0.488 |
0.940 |
1.589 |
2.524 |
1.584 |
|
B |
0.0 (0.0) |
0.119 (0.014) |
0.622 (0.048) |
0.503 (0.050) |
0.955 (0.020) |
1.622 (0.038) |
2.530 (0.081) |
1.575 (0.075) |
|
Vertical displacement |
||||||||
|
A |
0.519 |
0.544 |
0.906 |
0.362 |
1.156 |
1.588 |
0.531 |
-0.625 |
|
B1 |
0.530 |
0.536 |
0.887 |
0.351 |
1.119 |
1.375 |
0.393 |
-0.726 |
|
B2 |
0.523 |
0.535 |
0.948 |
0.413 |
1.116 |
1.349 |
0.401 |
-0.715 |
|
B3 |
0.547 |
0.559 |
0.918 |
0.359 |
1.118 |
1.382 |
0.435 |
-0.683 |
|
B4 |
0.534 |
0.564 |
0.908 |
0.344 |
1.196 |
1.417 |
0.429 |
-0.767 |
|
B5 |
0.524 |
0.536 |
0.911 |
0.375 |
1.173 |
1.446 |
0.446 |
-0.727 |
|
B |
0.532 (0.010) |
0.546 (0.014) |
0.914 (0.022) |
0.368 (0.027) |
1.144 (0.038) |
1.394 (0.038) |
0.421 (0.023) |
-0.724 (0.030) |
3. Changes in horizontal and vertical velocities of the center of mass
Table 5 presents the horizontal and vertical velocities of the center of mass. Across all major time frames, the top-level athlete had higher horizontal velocities than the colle- giate athletes. Horizontal velocity reductions of the top-level athlete were -1.61 m/s in the board contact phase and -1.33 m/s in the horse contact phase, which were higher than those of the collegiate athletes (-1.18 m/s and -1.10 m/s, respectively).
For changes in vertical velocity, the top-level athlete had higher accelerating velocities in the board and the horse contact phases (3.78 m/s and 0.35 m/s, respectively) than those of the collegiate athletes (2.91 m/s and 0.13 m/s, respectively). The top-level athlete approached the board with a higher horizontal velocity (6.85 m/s) than the sub- level collegiate athletes (5.97 m/s). The top-level athlete also showed a higher magnitude of vertical velocity (-1.08 m/s) than the collegiate athletes (-0.74 m/s) at the BTD. Among the collegiate athletes, athlete B2 had the highest horizontal velocity (6.08 m/s) and athlete B3 had the highest vertical velocity at the BTD (-0.96 m/s).
4. Distance between and orientation of hands at horse contact
For the hand distance between the left and the right hands at the moment of horse contact, the top-level athlete had a shorter distance by about 0.13 m (0.41 ± 0.05 m) than the collegiate athletes (0.54 ± 0.04 m). For orientation of hands, the right hand of the collegiate athletes (108.15 ± 4.27°) was rotated further about 8° more in the anti-clockwise direction than that of the top-level athlete (100.90 ± 12.54°).
|
BTD |
BTO |
ΔB |
HTD |
HTO |
ΔH |
LD |
|
|
Horizontal velocity |
|||||||
|
A |
6.85 |
5.24 |
-1.61 |
5.01 |
3.68 |
-1.33 |
- |
|
B1 |
5.84 |
4.88 |
-0.96 |
4.25 |
3.13 |
-1.12 |
- |
|
B2 |
6.08 |
4.79 |
-1.29 |
4.22 |
3.31 |
-0.91 |
- |
|
B3 |
6.02 |
4.81 |
-1.21 |
4.22 |
3.14 |
-1.08 |
- |
|
B4 |
5.89 |
4.53 |
-1.36 |
4.30 |
3.19 |
-1.11 |
- |
|
B5 |
6.03 |
4.95 |
-1.08 |
4.35 |
3.05 |
-1.30 |
- |
|
B |
5.97 (0.10) |
4.79 (0.16) |
-1.18 (0.16) |
4.27 (0.06) |
3.16 (0.10) |
-1.10 (0.14) |
- |
|
Vertical velocity |
|||||||
|
A |
-1.08 |
2.70 |
3.78 |
3.22 |
3.57 |
0.35 |
-5.46 |
|
B1 |
-0.78 |
1.90 |
2.68 |
2.61 |
2.53 |
-0.08 |
-4.85 |
|
B2 |
-0.96 |
2.14 |
3.10 |
2.34 |
2.62 |
0.28 |
-5.04 |
|
B3 |
-0.97 |
2.03 |
3.00 |
2.31 |
2.75 |
0.44 |
-5.14 |
|
B4 |
-0.56 |
2.57 |
3.13 |
2.81 |
2.63 |
-0.18 |
-5.22 |
|
B5 |
-0.45 |
2.20 |
2.65 |
2.83 |
3.00 |
0.17 |
-5.57 |
|
B |
-0.74 (0.23) |
2.17 (0.25) |
2.91 (0.23) |
2.58 (0.25) |
2.71 (0.18) |
0.13 (0.26) |
-5.16 (0.27) |
5. Shoulder angles
Table 6 presents the left and the right shoulder angles at HTD and at HTO. The angle of the left shoulder joint (the first contacting arm) at HTD of the top-level athlete (113.85 ± 4.43°) was extended by 10.27° more than the collegiate athletes (103.58 ± 4.43°), whereas the top-level athlete extended the right shoulder joint (the last con- tacting arm) less than the collegiate athletes. The angles of both shoulders were similar between the two groups at HTO.
Among the collegiate athletes, athlete B4 had the smal- lest left shoulder angle (99.32°) at HTD, and athlete B5 had the highest right shoulder angle (149.46°). Athlete B5 also showed the highest right shoulder angle (139.72) at HTO.
|
HTD |
HTO |
|
|
Left angles |
||
|
A |
113.85 |
119.09 |
|
B1 |
109.4 |
121.01 |
|
B2 |
106.86 |
119.01 |
|
B3 |
100.71 |
110.40 |
|
B4 |
99.32 |
131.20 |
|
B5 |
101.62 |
122.34 |
|
B |
103.58 (4.33) |
120.79 (7.45) |
|
Right angles |
||
|
A |
135.48 |
127.40 |
|
B1 |
140.98 |
115.03 |
|
B2 |
137.33 |
120.3 |
|
B3 |
139.81 |
123.44 |
|
B4 |
141.57 |
125.57 |
|
B5 |
149.46 |
139.72 |
|
B |
141.83 (4.56) |
124.81 (9.23) |
6. Elbow angles
The left and the right elbow angles at HTD and HTO are presented in Table 7. At HTD, the top-level athlete (131.05 ± 0.30°) extended the left elbow joint (the first contacting arm) by 9.79° and the right elbow joint (the last contacting arm) by 9.03° further than the collegiate athletes (121.26 ± 7.84° for the left) did. At HTO, while the left elbow angles were similar to each other, the top-level athlete (153.88 ± 11.23°) had a higher right elbow angle, which was the last arm taking off from the horse, compared to the collegiate athletes (144.65 ± 9.00°) did.
Among the collegiate athletes, athlete B5 (108.07°) had the smallest left elbow angle and athlete B1 (128.05°) the highest right elbow angle at HTD, respectively. At HTO, athlete B5 (158.46°) had the highest right elbow angle.
|
HTD |
HTO |
|
|
Left elbow angles |
||
|
A |
131.05 |
119.31 |
|
B1 |
128.05 |
115.31 |
|
B2 |
126.22 |
124.26 |
|
B3 |
122.33 |
111.83 |
|
B4 |
121.63 |
125.17 |
|
B5 |
108.07 |
113.77 |
|
B |
121.26 (7.84) |
118.07 (6.91) |
|
Right elbow angles |
||
|
A |
147.22 |
153.88 |
|
B1 |
128.05 |
133.30 |
|
B2 |
136.28 |
143.95 |
|
B3 |
147.12 |
144.85 |
|
B4 |
139.73 |
142.71 |
|
B5 |
139.76 |
158.46 |
|
B |
138.19 (6.91) |
144.65 (9.00) |
7. Hip angles
Table 8 presents the hip angles at major events for the top-level athlete and the sublevel collegiate athletes. While similar to each other at BTD and BTO, the top-level athlete had a higher hip angle at HTD (158.18 ± 2.15°) than the collegiate athletes (140.86 ± 11.58°). Thereafter, hip angles were similar at HTO; however, hip angles of the top-level athlete were 163.97 ± 6.51° at PH and 140.95 ± 0.45° at LD, which were higher than those of the sublevel athletes (140.86 ± 11.58° at PH and 131.13 ± 2.81° at LD, respec- tively). For hip joint movement at HTO and PH, the top-level athlete extended from HTO (145.83°) to PH (163.97°), whereas the sublevel collegiate athletes flexed from 141.57° to 135.26°. In particular, athletes B2 and B5 among the sublevel athletes showed more than 10° of flexion from HTO to PH.
|
BTD |
BTO |
HTD |
HTO |
PH |
LD |
|
|
A |
112.85 |
126.70 |
158.18 |
145.83 |
163.97 |
140.95 |
|
B1 |
114.90 |
127.75 |
132.35 |
127.00 |
126.81 |
132.48 |
|
B2 |
118.13 |
130.68 |
140.67 |
150.04 |
140.75 |
130.58 |
|
B3 |
124.24 |
137.31 |
131.48 |
130.56 |
124.39 |
131.43 |
|
B4 |
118.09 |
131.36 |
139.59 |
139.51 |
136.97 |
126.78 |
|
B5 |
114.65 |
126.05 |
160.20 |
160.74 |
147.39 |
134.36 |
|
B |
118.00 (3.87) |
130.63 (4.31) |
140.86 (11.58) |
141.57 (13.94) |
135.26 (9.61) |
131.13 (2.81) |
8. Knee angles
At BTD, the top-level athlete had a smaller knee angle (136.57 ± 2.88°) than the sublevel collegiate athletes (142.41 ± 4.09°), whereas the knee angle of the top-level athlete (172.46 ± 5.54°) at BTO was larger than that of the collegiate athletes (167.32 ± 5.75°). The top-level athlete showed about 36° of range of motion in knee angle at the BC phase, whereas the collegiate athletes showed 25° at the same phase.
9. Relative angle to the vault table
For relative angle to the vault table, the top-level and sublevel collegiate athletes had 5.62 ± 7.74° and 7.81 ± 7.42° at HTD, respectively, indicating that the top-level athlete approached more horizontally. On the other hand, relative angles to the vault table at HTO were 45.91 ± 0.02° for the top-level athlete and 52.11 ± 4.22° for the sub- level collegiate athletes, which indicated that the sublevel athletes took off more vertically.
10. Average impact forces
Average horizontal and vertical impact forces obtained from the board and the horse by application of the impulse-momentum equation are presented in Table 9. The top-level athlete had higher horizontal and vertical impact forces than the sublevel collegiate athletes. In par- ticular, the average vertical impact force of the top-level athlete at the vaulting table (151.7 N, 0.30 BW) was at least 2 times greater than that of the sublevel athletes (60.4 N, 0.10 BW).
Among the sublevel athletes, athletes B2 (149.3 N, 0.24 BW) and B3 (176.0 N, 0.32 BW) had impact forces close to or higher than those of the top-level athlete. On the contrary, athletes B1 (-29.0 N, -0.05 BW) and B4 (-59.0 N, -0.10 BW) had negative values, which meant they acquired no vertical impulse at the horse, affecting the total average value of the sublevel athletes negatively.
|
Board(N) |
(BW) |
Horse(N) |
(BW) |
|
|
Horizontal impact force |
||||
|
A |
-2,093.0 |
-4.10 |
-576.3 |
-1.13 |
|
B1 |
-1,392.0 |
-2.45 |
-406.0 |
-0.71 |
|
B2 |
-2,064.0 |
-3.29 |
-485.3 |
-0.77 |
|
B3 |
-1,694.0 |
-3.08 |
-432.0 |
-0.79 |
|
B4 |
-2,006.0 |
-3.47 |
-363.8 |
-0.63 |
|
B5 |
-2,196.0 |
-3.67 |
-495.6 |
-0.83 |
|
B |
-1,870.4 (324.8) |
-3.19 (0.47) |
-436.6 (55.0) |
-0.75 (0.08) |
|
Vertical impact force |
||||
|
A |
4,914.0 |
9.63 |
151.7 |
0.30 |
|
B1 |
3,886.0 |
6.83 |
-29.0 |
-0.05 |
|
B2 |
4,960.0 |
7.90 |
149.3 |
0.24 |
|
B3 |
4,200.0 |
7.65 |
176.0 |
0.32 |
|
B4 |
4,616.8 |
7.98 |
-59.0 |
-0.10 |
|
B5 |
5,388.3 |
9.00 |
64.8 |
0.11 |
|
B |
4,610.2 (595.9) |
7.87 (0.78) |
60.4 (104.3) |
0.10 (0.18) |
There have been only a few studies on the Tsukahara basic motions using the new vaulting table. Since athletes can perform advanced techniques only when they have mastered the basic techniques, this study intended to analyze kinematic differences in the Tsukahara basic vault between the top-level athlete (A) and the sublevel colle- giate athletes (B) in order to find out key points resulting in vaulting performance.
Unlike the handspring vault, the body needs to rotate by 90° when approaching to the horse in the Tsukahara vault, and the hands must contact the horse sequentially. In the case of an anti-clockwise rotated approach to the horse, the vaulting table is contacted by the left hand then the right hand in order.
Whereas Korean athletes tend to prefer the Tsukahara type vault, athletes from other countries prefer the hand- spring type vault (Yeo, 2003). Recently, there have been diverse studies to enhance the performance of advanced techniques (Lim, 2004; Kim, 2005; Lee et al., 2012; Park & Kim, 2014; Hong & Oh, 2015). Conclusively, Lee et al. (2006) reported that it was possible to perform advanced techni- ques only after basic techniques were completely mastered.
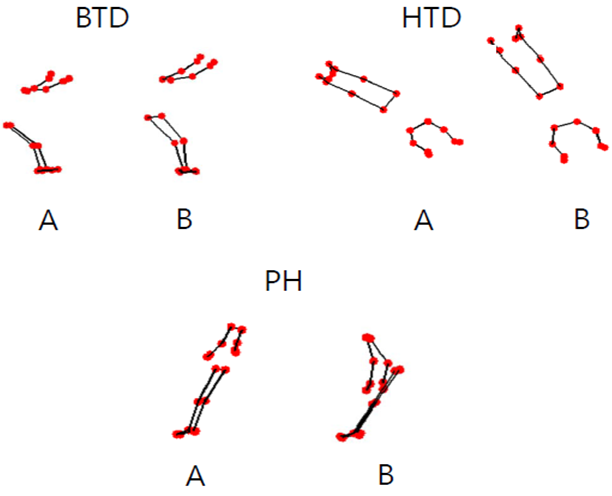
This study identified critical differences in motions by phase between a top-level athlete and sublevel collegiate athletes. First, the top-level athlete and the sublevel athletes showed the same board contact time (0.04 sec) but the top-level athlete had higher ranges of motion in hip and knee joints than the sublevel athletes. In a Driggs motion study, Kim (2005) reported that high-scoring athletes tended to have larger flexion angles of the hip and knee joints and to extend them faster. In other words, the top-level athlete in this study showed more hip and knee flexion and faster extension at board contact, which were strongly supported by previous studies. In contrast, the sublevel collegiate athletes approached the board with more ex- tended hip and knee joint angles than the top-level athlete did, so they were unable to fully utilize the reaction force from the board (Figure 3). Therefore, it is necessary for sublevel athletes to train to approach the board whilst maintaining optimal flexion angles of hip and knee joints by leaning the upper body forward right before BTD.
In the pre-flight phase, the top-level athlete showed a shorter phase time than the sublevel athletes. This caused a lower vertical position and a shorter horizontal displacement, which enabled a relatively lower angle of approach to the vault table. In contrast, the collegiate athletes approached with a longer phase time, a higher center of mass, and a relatively higher angle to the vault table (Figure 3). Lim (2004) reported that athletes with a less horizontal displace- ment in pre-flight approached the horse faster, allowing them to fully utilize the reaction force from the vaulting table, and Lee et al. (2005) also reported that a high scored group showed a landing angle about 10° lower than a low scored group. Thus the results of the top-level athlete in the present study were supported by previous studies.
In the horse contact phase, the top-level athlete had a shorter horse contact time than the sublevel collegiate athletes. In a Kasamatsu motion study, Lee et al. (2005) reported that the superior group tended to have a shorter average horse contact time. The short horse contact time is known to be a main factor in generating a greater impact force from the horse, which directly affects post-flight (Takei, 1988, 2000), in case of equal changes in momentum. Despite the non-equal changes in momentum, athletes B2 (0.12 sec) and B3 (0.14 sec) among the sublevel athletes had the same or similar horse contact times to that of the top-level athlete (0.12 sec). Hence, athletes B2 (0.24 BW) and B3 (0.32 BW) had similar to or higher average vertical impact forces from the horse than the top-level athlete (0.30 BW).
Body posture is important in shortening the horse con- tact time. In comparison to the sublevel athletes, the top-level athlete had a stronger touch-down to the board with a larger extension of the hip joint, contacted the horse with a shorter distance between the hands, and also showed an upper body posture with extended elbow and shoulder joints. In contrast, the sublevel athletes demon- strated a weaker touch-down to the board and a contact to the horse with a wider gap between the hands by 0.13 m compared to those of the top-level athlete (Figure 3). These factors resulted in flexion of the elbow and shoulder on both sides. When elbow and shoulder joints are flexed at horse contact, the horse contact time increases and impact forces decrease adversely. Thus, the posture of the sublevel collegiate athletes was likely to displace their body forward, rather than generating vertical velocity. Kim (2005) reported that high-scoring athletes showed higher shoulder joint extensions by about 21° at the horse contact than low scored athletes did, and were not displaced forward, which resulted in enhancement of vertical position by 0.19 m. Hence, this study emphasized the importance of the horse blocking by the upper arms.
In the post-flight phase, the top-level athlete had a longer phase time and a farther horizontal displacement than the sublevel collegiate athletes. Lee et al. (2005, 2006) claimed that a longer post-flight time and a longer hori- zontal movement distance were required to increase the chance of obtaining a high score, supporting the results of the top-level athlete in the present study. At HTD, the top-level athlete was able to perform an effective blocking with the left arm due to the postures of elbow and shoul- der joints, which enabled a take-off with the right elbow joint more extended at HTO than the collegiate athletes. In addition, the top-level athlete showed a take-off posture utilizing the reactive hinged hip extension as a result of proper delivery of impact forces through the upper limbs. In contrast, the sublevel athletes having insufficient hip extension at take-off could not make an extended posture such as the top-level athlete's posture but performed flexed-hip body rotation at PH (Figure 3). In particular, even athletes B2 and B3, who generated vertical impact forces from the horse similar to that of the top-level athlete, showed a flexed hip joint posture during the post¬flight phase as the result of insufficient hip extension at the moment of HTO. In other words, while the vertical impact forces of these two sublevel athletes were desirable, the vertical height at PH was not high enough due to improper posture of HTO.
When velocities of the center of mass were compared, the top-level athlete approached the board and the horse faster than the sublevel athletes, and converted horizontal velocity to vertical velocity efficiently through stronger hand blocking. The top-level athlete had a higher reduction of horizontal velocity at the board contact, and a greater reduction of velocity at the horse contact, which seemed to enable him to reach a higher vertical height during post-flight. Takei (1991b) reported that a superior athlete contacted the board and the horse with a higher horizontal velocity, inducing a greater conversion to vertical velocity, and then took off while maintaining a higher horizontal velocity. Despite having a higher reduction in velocity than the sublevel athletes, the top-level athlete had a higher horizontal velocity at PH, leading to a longer flight time.
In previous studies on the Tsukahara vault using the old type of vaulting table, Dilman et al. (1985) reported that a long horse contact time and single support of the weight by one arm decreased momentum during horse contact. Park and Song (2012) and Lim (2004) reported that a fast approach run was core requirement of obtaining a high vertical velocity and insisted that strong blocking at horse contact was the key point in converting horizontal velo- city to a vertical component (Yeo, 2003). Taken together, although a high horizontal velocity on the approach run is important in the vault, the results of the current study suggested that postures when approaching the horse are more crucial. Therefore, it is considered important to correct the posture of the hip joint to block with both arms, and to increase the horizontal velocity in the vertical direction. For effective blocking using two arms, it is necessary to reduce the distance between the hands for an almost simultaneous horse contact, and to effectively extend the hip joint during take-off from the horse.
Some variables in the 5 sublevel individuals did not differ from those of the top-level athlete. In other words, there seems to be variability even within a sublevel group. Thus, it is worthwhile to conduct a further in-depth study to discover the relationships between postural variables and velocity variables within sublevel groups. Nevertheless, the present study has a limitation in generalizing results to whole population due to limited 5 sublevel athletes. Thus, a follow up study should be conducted with a larger sample size using inferential statistics.
The present study was a 3-dimensional kinematic analysis of the stretched salto motion in the Tsukahara vault, which is considered the most basic motion in the Tsukahara vault. This aimed to provide coaches and young athletes learning the Tsukahara vault for the first time with helpful infor- mation for technical acquisition. Based on comparisons of postural variables between the top-level athlete and the sublevel collegiate athletes, conclusions were drawn as follows:
First, while the top-level athlete and the sublevel athletes had the same event time at the board contact phase, the top-level athlete had higher ranges of motion of the hip and knee joints than the sublevel athletes.
Second, the top-level athlete had a shorter pre-flight time than the collegiate athletes. The top-level athlete had a lower and shorter horizontal displacement than the sub- level athletes, and showed a relatively lower angle to the vault table.
Third, the top-level athlete had shorter horse contact time than the sublevel athletes did. During the horse contact, the top-level athlete had a more extended hip joint than the collegiate athletes, had a narrower distance between the hands, and extended the elbow and shoulder joints.
Fourth, the top-level athlete had a longer flight time in the post-flight phase than the collegiate athletes, resulting in a longer horizontal displacement. The top-level athlete generated a kick up of the body through hip joint extension from HTO to PH, whereas the collegiate athletes showed hip joint flexion. In conclusion, postures in approaching and contacting the horse are crucial in order to perfect the basic motion in the Tsukahara vault, although a high hori- zontal velocity component is also important. It is necessary for athletes to practice the correct posture repeatedly prior to attempting to learn advanced techniques in training sessions whilst paying attention to the importance of pos- tures.
References
1. Back, J. H., Lee, S. H., Choi, K. J., Moon, Y. J., Kim, D. M. & Park, J. H. (2005). Kinematical Analysis of Ropez Motion in Horse Vault. Korean Journal of Sport Biomechanics, 15(2), 119-127.
Crossref
Google Scholar
2. Dilman, C., Cheetham, P. & Smith, S. L. (1985). A kinematic analysis of men’s Olympic long horse vaulting. Inter- national Journal of Sport Biomechanics, 1, 96-110.
Crossref
Google Scholar
3. FIG (2013). Federation of International Gymnastics. Inter-national Code of point-Man's Artistic Gymnastic
Crossref
4. Hong, W. K., & Oh, J. S. (2015). A Study on Qualitative and Qualitative Analyses of Tsukahara Triple - Focusing on a Single Case -. The Korea Journal of Sport Science, 24(3), 1629-1638.
Crossref
5. Kim, Y. J. (2005). The kinematic analysis of driggs motion in horse vaulting - A case study. The Korean Journal of Sport Biomechanics, 15(3), 175-183.
Crossref
Google Scholar
6. Lee, S. H., Back, J. H., Kim, Y. S. & Kong, T. U. (2005). The kinematic analysis of Kasamatsu in vault. The Korean Journal of Sport Biomechanics, 15(4), 1-11.
Crossref
Google Scholar
7. Lee, S. H., Park, J. H. & Lee, J. H. (2006). Kinematic Analysis of Acopian in Vault. The Korean Journal of Sport Bio-mechanics, 16(1), 89-99.
Crossref
Google Scholar
8. Lee, S. H., Song, J. H. & Park, J. C. (2012). Case study of Tsukahara Triple motion in gymnastic vault. The Korea Journal of Sport Science, 21(6), 1529-1539.
Crossref
9. Lim, K. C. (2004). Biomechanical analysis of Tsukahara vault with double salto backward piked. The Korean Journal of Sport Biomechanics, 14(3), 135-147.
Crossref
Google Scholar
10. Park, C. H. & Kim, Y, K. (2014). Kinematic Comparisons between Yang-1 and Yang-2 Vaults in Men's Artistic Gymnastics. The Korean Journal of Sport Biomechanics, 24(4), 317-327.
Crossref
Google Scholar
11. Park, J. H. & Song, J, H. (2012). The kinematic analysis of Yang Hak Seon vault. Korean Journal of Sport Science, 23(3), 702-717.
Crossref
Google Scholar
12. Park, J. H., Youn, S. H., Back, J. H., Kim, D. M. & Chung, N. J. (2003). The Kinematical analysis of ropez motion in horse vaulting. The Korean Journal of Physical Education, 42(3), 697-708.
Crossref
Google Scholar
13. Takei, Y. (1991b). Comparison of blocking and post-flight techniques of male gymnasts performing the 1988 Olympic compulsory vault. International Journal of Sport Biomechanics, 7, 371-391.
Crossref
14. Takei, Y. (1988). Techniques used in performing handspring and salto forward tucked in Gymnastic vaulting. Inter- national Journal of sport Biomechanics, 4, 260-281.
Crossref
Google Scholar
15. Takei, Y. (1989). Techniques Used by Elite Male Gymnastic Performing a Handspring Vault at the 1987 Pan American Games. International Journal of sport Bio- mechanics, 5, 1-25.
Crossref
16. Takei, Y., Blucker, E. P., Hudert D. J., Myers, S. A. & Fortney, V. L. (1996). A Three-dimensional analysis of the men's coopulsory vault performed at the 1992 Olympic Game. Journal of Applied Biomechanics, 12, 237-257.
Crossref
Google Scholar
17. Takei, Y. (1998). Three-dimensional analysis of handspring with full turn vault: Deterministic model, coaches' beliefs, and judges' scores. Journal of Applied Biomechanics, 14, 190-210.
Crossref
18. Takei, Y. (2007). The Roche Vault Performed by Elite Gym- nasts: Somersaulting Technique, Deterministic Model and Judges' Scores. Journal of Applied Biomechanics, 23, 1-11.
Crossref
19. Takei, Y., Blucker, E. P., Nohara, H. & Yamashita, N. (2000). The Hecht vault performed at the 1995 World Gym- nastics Championships: Deterministic mode and judges' scores. Journal of Sports Science, 18(11), 849-863.
Crossref
Google Scholar
PubMed
20. Yeadon, M. R., King, M. A. & Sprigings, E. J. (1998). Pre-flight characteristics of Hecht vaults. Journal of Sports Science, 16(4), 349-356.
Crossref
Google Scholar
PubMed
21. Yeo, H. C. (2003). Kinematic Analysis of Yeo motion at horse vaulting. The Korean Journal of Sport Biomechanics, 13(1), 39-50.
Crossref
Google Scholar
22. Yeo, H. C. (2006). The Kinetic Analysis for Coaching Methods Through Yurchenko's 720 Degree Twist Technique with Stretched Body. The Korean Journal of Physical Education, 45(5), 495-505.
Crossref
Google Scholar
