Open Access, Peer-reviewed
eISSN 2093-9752
Open Access, Peer-reviewed
eISSN 2093-9752
Seung Hyun Hyun
Che Cheong Ryew
http://dx.doi.org/10.5103/KJSB.2017.27.2.109 Epub 2017 July 15
Abstract
Objective: This study aimed to investigate the relationship between leg stiffness and kinematic variables according to load while running.
Method: Participants included eight healthy men (mean age, 22.75 ± 1.16 years; mean height: 1.73 ± 0.01 m; mean body weight, 71.37 ± 5.50 kg) who ran with no load or a backpack loaded with 14.08% or 28.17% of their body weight. The analyzed variables included leg stiffness, ground contact time, center of gravity (COG) displacement and Y-axis velocity, lower-extremity joint angle (hip, knee, ankle), peak vertical force (PVF), and change in stance phase leg length.
Results: Dimensionless leg stiffness increased significantly with increasing load during running, which was the result of increased PVF and contact time due to decreased leg lengths and COG displacement and velocity. Leg length and leg stiffness showed a negative correlation (r = -.902, R2 = 0.814). COG velocity showed a similar correlation with COG displacement (r = .408, R2 = .166) and contact time (r = -.455, R2 = .207).
Conclusion: Dimensionless leg stiffness increased during running with a load. In this investigation, leg stiffness due to load increased was most closely related to the PVF, knee joint angle, and change in stance phase leg length. However, leg stiffness was unaffected by change in contact time, COG velocity, and COG displacement.
Keywords
Leg stiffness Load Running Relationship Kinematic variables
Humans change their walking and running patterns to conserve energy and increase speed during locomotion (Cappellini, Ivanenko, Poppele, & Lacquaniti, 2006). Running, a popular activity worldwide, is a major component of various sports (Cheung & Rainbow, 2014) and has a known positive effect on cardiovascular and mental health (Williams, 2009a, 2009b).
However, as numerous people participate in running, some issues are being reported, with 39~85% of runners reporting that they have experienced injuries in the past year (Bovens et al., 1989; van Gent et al., 2007; Watson, 1987). In addition, Taunton et al. (2002) showed that, regardless of sex, those injured due to running show a strongly positive relationship between tibial stress syndrome and the occurrence of injury; this is related to the risk of patellofemoral pain, iliotibial band friction syndrome, and plantar fasciitis. It is also known that the risk of spinal damage for women with a body mass index (BMI) < 21 kg/ is very high.
To improve running efficiency and prevent injury, studies have investigated the complexity of legs; it is now generally assumed that most of the energy that is consumed by muscles during running is used to convert chemical energy to mechanical energy (Alexander, 1980). Taylor, Heglund, & Maloiy (1982) explained that the greater the hopping speed of a kangaroo, the more economical it is; it was also reported that input mechanical energy is temporarily stored in the elastic material of the active muscle for use in subsequent muscle actions (Asmussen & Bonde-Petersen, 1974).
From this perspective, although the motion of human running is performed by a complex musculoskeletal system composed of muscles, tendons, and ligaments, it functions very similarly to a single linear spring (Farley & Gonzalez, 1996). Therefore, the dynamics of human running can use the spring-mass model to very accurately explain the complex movements of the legs (Arampatzis, Brüggemann, & Metzler, 1999; Blum, Lipfert, & Seyfarth, 2009; Donelan & Kram, 2000; Farley & Gonzalez, 1996; Lipfert, Günther, Renjewski, Grimmer, & Seyfarth, 2012; McMahon & Cheng, 1990). In the spring-mass model, the legs are seen as linear springs with no mass, while the stiffness of the leg spring was closely related to the peak vertical force (PVF) and change in leg length during ground contact (Farley, Glasheen, & McMahon, 1993). In addition, leg stiffness differed among terrains and was inversely pro- portionate to the stiffness of the surface to which the locomotion is applied (Alexander, 1989, 1992; Feehery, 1986). Ferris, Louie, & Farley (1998) reported that the leg stiffness of animals is not related to speed or gravity but is determined by musculoskeletal characteristics; however, they reported that if stiffness is unchanged on different surfaces, similar running motions can be sustained by changing the characteristics of running (PVF, contact time).
There are reports that humans also can regulate leg stiffness while running (Farley, Blickhan, Saito, & Taylor, 1991; Farley & Gonzalez, 1996); for optimal locomotion, a certain level of stiffness must be maintained (Arampatzis et al., 1999; Dutto & Smith, 2002; Kerdock, Biewener, McMahon, Weyand, & Herr, 2002; Kuitunen, Komi, & Kyröläinen, 2002; McMahon & Cheng, 1990; Seyfarth, Geyer, Günther, & Blickhan, 2002; Stefanyshyn & Nigg, 1998). However, during the motions of running in the early stages of ground contact, the distance between the center of gravity (COG) and parts of the feet that reach the minimal level in the mid-stance phase beginning with the curve of the angle of the hip, knee, and ankle (McMahon & Cheng, 1990) and in each instance the foot contacts the ground, a repeated left-right, font-back, vertical direction impact occurs (Ryu, 2013, 2014, 2015). In addition, the average ground contact time is 0.24 sec, the change in leg length is 7.3%, and the PVF is a mean 2.3 times the individual’s body weight (Silder, Besier, & Delp, 2015).
However, despite the availability of this information, many people are often forced into situations in which they must move objects during everyday life. In addition, we often observe elite athletes or ordinary people who want to gain quick effects of exercise by running with the addition of vests, lead, or sandbags. Thus, leg stiffness, which is affected by mass on solid ground, must be appropriately regulated, but information on the regulation of leg stiffness following changes in mass are very limited, and leg stiffness using the spring-mass model is only explained as an increase proportional to the increase in mass in various animals (Farley et al., 1993).
Although many studies have analyzed and interpreted the correlation between changes in leg stiffness and related variables to investigate the characteristics of motion while running, they are merely explained by the differences in the increase or decrease of specific variables. That is, in addition to PVF, leg joint angle (hip, knee, ankle) and changes in leg length, ground contact time, and movement speed are all important factors in leg stiffness analysis, but there is a need to more clearly understand their relationship. In addition, as PVF is an important factor in stiffness level and load changes vary based on an individual's goals in everyday life, new research on the efficiency of locomotion and the provision of improved efficiency that applies more varied changes in loads is needed.
Therefore, the purpose of this study is to quantitatively analyze the relationship between leg stiffness and kinematic variables by load during running. We especially aimed to provide useful information to decrease injuries that can occur due to changes in loads during running, increase efficiency, and accumulate basic material related to leg stiffness focusing on various changes in loads.
1. Subject
Eight adult men (mean age, 22.75 ± 1.16 years; mean height, 1.73 ± 0.01 m; mean body weight, 71.37 ± 5.50 kg) who were able to run normally were selected as subjects. Before the experiment, all subjects were informed of its purpose and contents, and those who voluntarily wished to participate provided written informed consent.
2. Experimental procedure
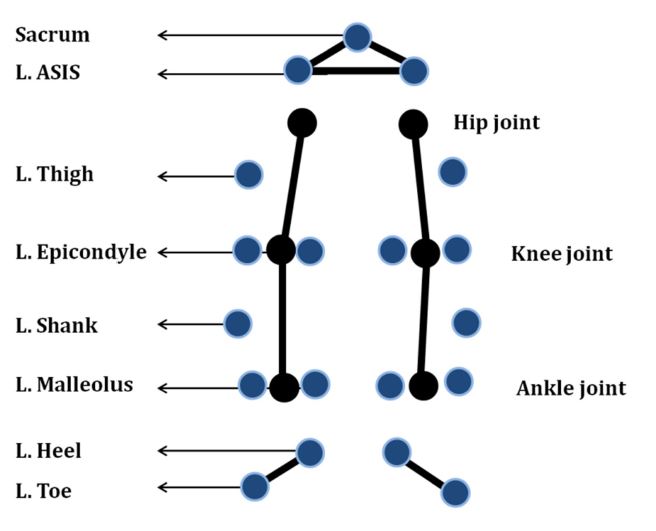
The personal trial times for all subjects were recorded, and each per- formed a sufficient warmup to avoid musculoskeletal system strain. The runs were mostly 15-m long, and a force plate (AMTI-OR-7, USA) was installed at the 8-m mark. The Kwon 3D XP (2007) program (Visol, Korea) was used to analyze the visual data, and four cameras (HDR-HC7/HDV 1080i, SONY) and lights were installed. After the camera speed was set at 60 frames/sec, exposure time at 1/500 sec, and force plate sampling rate at 600 Hz, a control object (2 m × 2 m × 1 m) was recorded to set three-dimensional (3D) spatial coordinates. At this time, the margin of error for the 3D spatial coordinates was 4.16 mm. After these spatial coordinates were set, to quantify the video material of subjects per- forming the motions, 19 reflective markers were attached as shown in (Figure 1) (right and left toe, right and left heel, right and left lateral and medial malleolus, right and left shank, right and left lateral and medial epicondyles, right and left thigh, right and left anterior superior iliac spine, and sacrum).
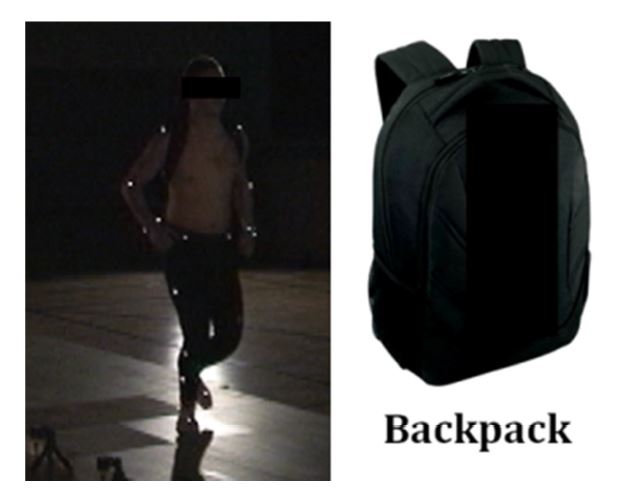
Running was first performed with no load (0 kg), followed by the carrying of backpacks weighing 10 kg (14.08 ± 1.10% of the body weight) or 20 kg (28.17 ± 2.20% of the body weight) in a random order. As shown in (Figure 2), the backpack was black; to minimize discomfort during running and considering motion changes due to re- bounds, the backpack was tightly attached to the body using shoulder and waist straps. Since the change in leg length was important in this study, errors due to shoe cushioning and data errors due to artificial speed control were considered when the subjects ran barefoot at their preferred speeds.
As such, three trials (3 × 3) based on individual weight were performed. At this time, whether the subject performed the motion at the preferred speed and in the preferred motion relied on the subject's testimony, and the researcher examined whether the subject's entire foot was located atop the force plate and used the successful 1 trial in the analysis. The spatial coordinates were set with the running direction on the Y axis, the left and right of the progress on the X axis, and vertical to the X and Y axis on the Z axis.
3. Lower-limb angles
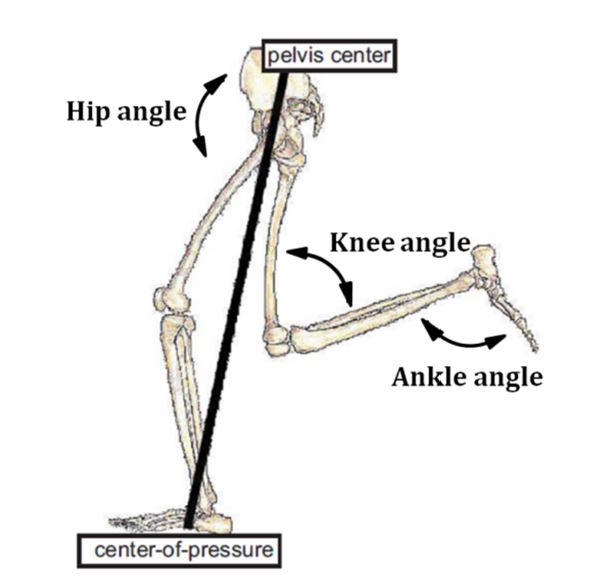
The angles of the lower limbs during running following a load change were as follows (Figure 3):
- Hip joint angle: formed by the trunk and thigh
- Knee joint angle: formed by the thigh and lower leg
- Ankle joint angle: formed by the lower leg and foot
4. Data analysis
The kinematic variables of running motion following load changes were calculated using the Kwon 3D XP ver. 4.0 (2007) program (Visol). The coordinates of the control points, body joint points, and 3D spatial points were calculated through direct linear transformation as described by Abdel-Aziz & Krara (1971). The research variables were analyzed with a cutoff frequency of 6 Hz using the low-pass filter method by Butterworth for smoothing and noise reduction. The analyzed variables included dimensionless leg stiffness, PVF, leg length (%), ground con- tact time, COG displacement and velocity on the Y axis, and lower extremity joint angle (hip, knee, ankle) during ground contact of the right foot.
Dimensionless leg stiffness (K_leg) was calculated using the method proposed by Silder et al. (2015), and the section from the time the right foot first makes contact to when the toe breaks contact after ground contact was analyzed (Formula 1).
Formula 1. Dimensionless leg stiffness
The PVF, which is created during ground contact, is a value that is standardized by dividing it by each subject's body weight; is the standardized value of the change in leg length during the stance phase; and
is the minimum leg length. Leg length was measured by calculating the length from the center of pressure (Bullimore & Burn, 2006) to the center of the pelvis (Plagenhoef, Evans, & Abdelnour, 1983) as shown in Figure 3.
After the mean and standard deviation of the kinematic/kinetic variables calculated above was calculated using the PASW 18.0 statistics program, while repeated-measures analysis of variance was performed after each load was carried (×3). The relationship between each variable was understood through correlations, and the change in each variable (∆%) by load during running was analyzed using Pearson correlation coefficients. All statistical levels of significance were set at α = .05.
1. Result of kinematic variables
The results of kinematic variables according to loads during running are shown in (Table 1). The contact time of the right foot increased as the load increased and was statistically significant (p < .001). The change in COG displacement and velocity on the Y axis decreased significantly as the load increased (p < .05).
|
Section |
Backpack load |
F |
p value |
||
|
None |
10 kg |
20 kg |
|||
|
Ground contact time (sec) |
0.33 ± 0.02 |
0.36 ± 0.03 |
0.39 ± 0.02 |
18.001 |
.001*** |
|
COG displacement in the Y axis
(m) |
1.05 ± 0.06 |
1.05 ± 0.07 |
0.99 ± 0.06 |
4.476 |
.031* |
|
COG average velocity in the
Y axis (m/sec) |
3.07 ± 0.16 |
2.94 ± 0.32 |
2.65 ± 0.17 |
8.301 |
.004** |
2. Lower-extremity joint angles
Changes in both lower-extremity joint angles by load during running were analyzed. The analysis was based on the time of ground contact of the right lower extremity shown in (Table 2). The angle of the hip and ankle joints did not change much among loads and did not differ statistically (p > .05). The angle of the knee joint increased as the load increased and the difference was statistically significant (p < .05).
|
Section |
Backpack load |
F |
p value |
||
|
No load |
10 kg |
20 kg |
|||
|
Right hip angle (degree) |
142.25 ± 4.09 |
141.99 ± 7.84 |
141.81 ± 7.53 |
0.012 |
.988 |
|
Right knee angle (degree) |
142.44 ± 6.96 |
145.12 ± 5.19 |
149.76 ± 4.47 |
6.513 |
.038* |
|
Right ankle angle (degree) |
84.76 ± 5.01 |
83.04 ± 3.18 |
81.12 ± 5.04 |
2.965 |
.084 |
3. Dimensionless leg stiffness variables
The changes in leg stiffness and related variables by load during running are shown in (Table 3). Leg stiffness and PVF increased as load increased and were statistically significant (p < .001). On the other hand, leg length (%) decreased as load increased and was statistically significant (p < .01).
|
Section |
Backpack load |
F |
p value |
||
|
None |
10 kg |
20 kg |
|||
|
Dimensionless leg stiffness |
30.25 ± 4.94 |
37.30 ± 4.47 |
43.07 ± 5.54 |
21.661 |
.001*** |
|
Peak vertical force (N/BW) |
2.36 ± 0.15 |
2.56 ± 0.16 |
2.60 ± 0.15 |
19.663 |
.001*** |
|
Change in stance phase leg length (%) |
7.93 ± 0.99 |
6.91 ± 0.63 |
6.11 ± 0.63 |
10.338 |
.002** |
4. Correlation results
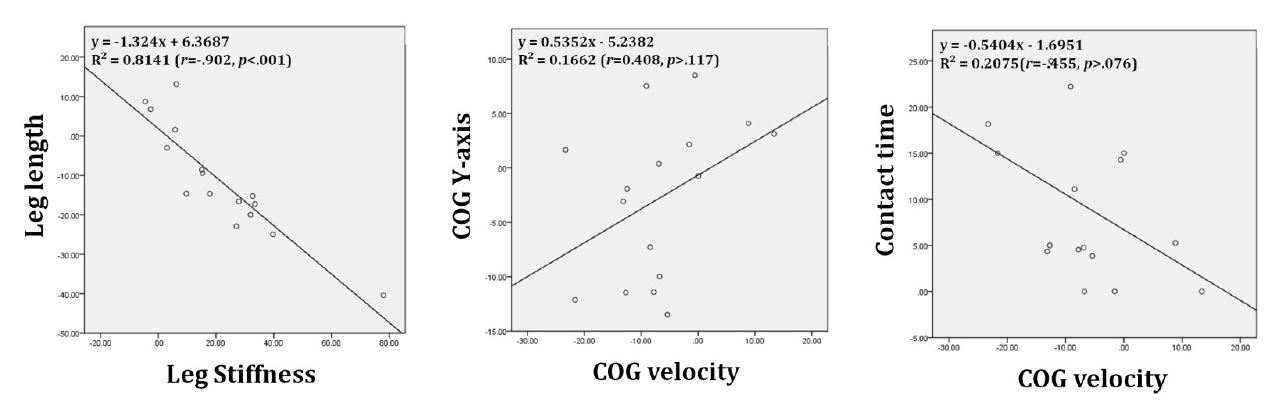
The results of the correlation analysis of each variable by load during running are shown in (Table 4). The results of analysis using the change (∆%) between 0 kg and 20 kg to establish the characteristics of each variable by load showed that the r was -.902 between leg length and leg stiffness, indicating a very strong negative correlation. In addition, r was .408 between COG velocity and COG displacement on the Y axis and r was -.455 between contact times, showing a correlation (Figure 4).
|
Section |
PVF |
Leg length |
Leg stiffness |
COG on the Y axis |
Contact time |
COG velocity |
|
PVF |
1 |
.274 |
.114 |
.248 |
-.281 |
-.390 |
|
Leg length |
1 |
-.902* |
-.148 |
-.330 |
-.187 |
|
|
Leg stiffness |
1 |
.219 |
.251 |
.331 |
||
|
COG on the Y axis |
1 |
.289 |
.408 |
|||
|
Contact time |
1 |
-.455 |
||||
|
COG velocity |
1 |
While the complex motion of the lower extremities during running have been investigated using the spring-mass model (Arampatzis et al., 1999; Blum et al., 2009; Donelan & Kram, 2000; Farley & Gonzalez, 1996; Lipfert et al., 2012; McMahon & Cheng, 1990), the load used with running varies greatly based on an individual's goal and kinematic in- formation about lower-extremity motion is lacking. Although study results have implicated that the ability to sustain an appropriate level of leg stiffness during running effectively prevents injury (Butler et al., 2003), the method and material about sustaining this level is lacking and leg stiffness and related variables according to load change have only been explained through simple differences in increases or decreases (Silder et al., 2015). Therefore, this study conducted a correlation analysis between leg stiffness and related variables to provide quantitative information required to increase locomotive efficiency and prevent injury.
In this study, dimensionless leg stiffness and PVF, which was standardized using body weight, increased proportionately with load increases and was statistically significant. These results are similar to those of the report that stated that the proportional relationship of body weight to leg stiffness can be seen in various animals that run at similar speeds (Farley et al., 1993). However, the variable of interest was leg length (%); unlike the increase trend in leg stiffness showed change by decreasing, and the value of r = -.902 between leg stiffness and leg length showed a very large inverse proportion relationship.
Under conditions in which movement speed during running must be increased, the range of motion of the knee and ankle joints increases to maintain momentum (Bishop, Fiolkowski, Conrad, Brunt, & Horodyski, 2006; Schache et al., 2011). However, the results of this study, which was conducted at each participant's preferred speed and investigated natural lower-limb movement by load increases during running, showed significantly less bending in the angle of the knee joint. That is, during running, the bend of the knee can reduce vertical stiffness and the force of impact moves from the foot to the cranium (Hewett et al., 1999; McMahon, Valiant, & Frederick, 1987), and the loads of 14.08% and 28.17% of body weight applied in this study is inferred to be an important factor in limiting the bending/extending motion of the lower limbs during running and further increasing leg stiffness. In addition, the decrease in change of the leg length, as confirmed in this study, is the result of the knee joint ankle extending in the opposite direction. It is also very similar to the results of Silder et al. (2015) in that when runs were conducted that applied loads of 10%, 20%, or 30% of the individual's body weight, leg length gradually decreased and leg stiffness increased.
Meanwhile, during locomotion, the decrease in lower-limb range of motion and the increase in PVF further increase leg stiffness (Butler et al., 2003; Grimston, Engsberg, Kloiber, & Hanley, 1991), and the two factors reportedly contribute to an increased risk of stress fractures (Grimston et al., 1991) and load factors related to increased impact on the lower limbs (Hennig & Lafortune, 1991). Load factor in particular is a measure of stress application rate on the organs (Cook, Farrell, Carey, Gibbs, & Wiger, 1997; Wit, Clercq, & Lenoir, 1995), and the stress degree during a unit of time can be interpreted quantitatively (Hargrave, Carcia, Gansneder, & Shultz, 2003). This implies that there is a need for future research that simultaneously analyzes the relationship between leg stiffness and load factor to elucidate the factors contributing to injuries by changes in loads during running.
In this study, with the increased load during running in addition to increased leg stiffness, PVF, and leg length, also decreased COG velocity and COG displacement and increased contact time. In particular, even when both COG velocity and COG displacement decreased (r = .408, R2 = 0.1662) to a state at which running momentum decreased, leg stiffness further increased. He, Kram, & McMahon (1991) and Farley et al. (1993) reported that running speed had no effect on leg stiffness, and they stated that the vertical movement and contact time were determined by the combination of leg spring strength and the gentle curve angle of the spring-mass model. This explains why, during fast movement speeds, the leg spring can create a gentle curve shape at a larger angle when ground contact time decreases. On the other hand, Luhtanen & Komi (1980) and Mero & Komi (1986) explain only the positive relationship of speed increase and spring constant increase. Compared to the results mentioned above, this result showed that movement speed and the decrease in forward movement displacement did not have a large impact on leg stiffness; rather, these characteristics are thought to further decrease the swing curve range of the leg spring, which increases leg stiffness. As such, to efficiently use kinetic energy during running, the input kinetic energy must be temporarily stored in the elastic material in the active muscle for use in later muscle actions (Asmussen & Bonde-Petersen, 1974), but loads other than body weight increase leg stiffness and further decrease elastic material.
It is reported that as the time integral of ground reaction force in terms of ground contact of one foot being the product function of the contact time and total load including the additional load, if contact time is increased, a smaller PVF can be created than the additional load (Silder et al., 2015). However, regarding the correlation analysis of this study, COG velocity and contact time have an inversely proportional relationship (r = -.455, R2 = 0.207), and it is inferred that due to the increased load during running, the decrease in COG velocity delays contact time. Studies of leg stiffness suggest that increasing the curve/ extension movement range of the lower limb joint angle during running (Butler et al., 2003) or reducing ground contact time can decrease or maintain the shock absorption of the musculoskeletal system and leg stiffness (Farley et al., 1993; He et al., 1991; McMahon & Cheng, 1990). On the other hand, increasing the movement range of the lower-limb joints may effectively increase shock absorption and prevent injury, thereby increasing leg muscle activity and ultimately increasing energy costs (Steele, Seth, Hicks, Schwartz, & Delp, 2010; Hortobágyi, Finch, Solnik, Rider, & Devita, 2011; Silder et al., 2015; Teunissen, Grabowski, & Kram, 2007). Future studies must identify whether these characteristics cause changes in leg movements considering the need for efficient body energy metabolism during long running times or whether changes are unavoidable due purely to load changes.
If mass is added to the body during running, greater leg stiffness is maintained to sustain the greater load, but the elastic material is decreased. Accordingly, various methods must be considered to regulate leg length changes and decrease injury rates and leg stiffness.
The purpose of this study was to analyze the relationship between leg stiffness and kinematic variables by load during running. Eight adult men ran at the preferred speed with loads of 0 kg, 10 kg (14.08%), and 20 kg (28.17%). The analysis of leg stiffness, ground contact time, COG displacement and position on the Y axis, mean COG velocity, lower-extremity joint angle (hip, knee, ankle), PVF, and change in stance phase leg length led to the following conclusions.
An increase in load during running led to an increase in leg stiffness. This is due to an increase in PVF, contact time, and change rate in leg length; decrease in COG displacement and velocity on the Y axis; and decreased curved knee joint angles. In the correlation analysis, r was -.902 between leg length and leg stiffness, showing a very high negative correlation. In addition, r was .408 between COG velocity and COG displacement on the Y axis and r = -.455 between contact times, showing correlation.
To change the leg length change rate in cases in which loads are added during running, first we suggest future research on changes in leg stiffness based on shoe cushioning or various surface conditions (asphalt, grass, dirt, urethane, etc.).
References
1. Abdel-Aziz, Y. I. & Karara, H. M. (1971). Direct liner transformation from comparator into object space coordinates inclose-range photogrammetry. Proceeding of the Symposium on close-range Photogrammetry (1-18). Falls church, VA: American society of photogrammetry.
Crossref
Google Scholar
2. Alexander, R. (1980). Optimum walking techniques for quadrupeds and bipeds. Journal of Zoology, 192(1), 97-117.
Crossref
Google Scholar
3. Alexander, R. M. (1989). Optimization and gaits in the locomotion of vertebrates. Physiological Reviews, 69(4), 1199-1227.
Crossref
Google Scholar
PubMed
4. Alexander, R. M. (1992). A model of bipedal locomotion on compliant legs. Philosophical Transactions of the Royal Society B: Biological Sciences, 338(1284), 189-198.
Crossref
Google Scholar
5. Arampatzis, A., Brüggemann, G. P. & Metzler, V. (1999). The effect of speed on leg stiffness and joint kinetics in human running. Journal of Biomechanics, 32(12), 1349-1353.
Crossref
Google Scholar
PubMed
6. Asmussen, E. & Bonde-Petersen, F. (1974). Apparent efficiency and storage of elastic energy in human muscles during exercise. Acta Physiologica Scandinavica, 92(4), 537-545.
Crossref
Google Scholar
7. Bishop, M., Fiolkowski, P., Conrad, B., Brunt, D. & Horodyski, M. (2006). Athletic footwear, leg stiffness, and running kinematics. Journal of Athletic Training, 41(4), 387.
Crossref
Google Scholar
8. Blum, Y., Lipfert, S. W. & Seyfarth, A. (2009). Effective leg stiffness in running. Journal of Biomechanics, 42(14), 2400-2405.
Crossref
Google Scholar
PubMed
9. Bovens, A. M. P., Janssen, G. M. E., Vermeer, H. G. W., Hoeberigs, J. H., Janssen, M. P. E. & Verstappen, F. T. J. (1989). Occurrence of running injuries in adults following a supervised training program. International Journal of Sports Medicine, 10(3), 186-190.
Crossref
Google Scholar
10. Bullimore, S. R. & Burn, J. F. (2006). Consequences of forward translation of the point of force application for the mechanics of running. Journal of Theoretical Biology, 238(1), 211-219.
Crossref
Google Scholar
11. Butler, R. J., Crowell, H. P. & Davis, I. M. (2003). Lower extremity stiffness: implications for performance and injury. Clinical Biomechanics, 18, 511-517.
Crossref
Google Scholar
12. Cappellini, G., Ivanenko, Y. P., Poppele, R. E. & Lacquaniti, F. (2006). Motor patterns in human walking and running. Journal of Neurophysiology, 95(6), 3426-3437.
Crossref
Google Scholar
13. Cheung, R. T. & Rainbow, M. J. (2014). Landing pattern and vertical loading rates during first attempt of barefoot running in habitual shod runners. Human Movement Science, 34, 120-127.
Crossref
Google Scholar
14. Cook, T. M., Farrell, K. P., Carey, I. A., Gibbs, J. M. & Wiger, G. E. (1997). Effects of restricted knee flexion and walking speed on the vertical ground reaction force during gait. Journal of Orthopaedic & Sports Physical Therapy, 25(4), 236-244.
Crossref
Google Scholar
15. Delp, S. L., Loan, J. P., Hoy, M. G., Zajac, F. E., Topp, E. L. & Rosen, J. M. (1990). An interactive graphics-based model of the lower extremity to study orthopaedic surgical procedures. ⅠEEE Transactions on Biomedical Engineering, 37(8), 757-767.
Crossref
16. Donelan, J. M. & Kram, R. (2000). Exploring dynamic similarity in human running using simulated reduced gravity. Journal of Experimental Biology, 203(16), 2405-2415.
Crossref
Google Scholar
17. Dutto, D. J. & Smith, G. A. (2002). Changes in spring-mass characteristics during treadmill running to exhaustion. Medicine and Science in Sports and Exercise, 34(8), 1324-1331.
Crossref
Google Scholar
18. Farley, C. T. & Gonzalez, O. (1996). Leg stiffness and stride frequency in human running. Journal of Biomechanics, 29(2), 181-186.
Crossref
Google Scholar
PubMed
19. Farley, C. T., Blickhan, R., Saito, J. & Taylor, C. R. (1991). Hopping frequency in humans: a test of how springs set stride frequency in bouncing gaits. Journal of Applied Physiology, 71(6), 2127-2132.
Crossref
Google Scholar
20. Farley, C. T., Glasheen, J. & McMahon, T. A. (1993). Running springs: speed and animal size. Journal of Experimental Biology, 185(1), 71 -86.
Crossref
Google Scholar
21. Feehery Jr, R. V. (1986). The biomechanics of running on different surfaces. Clinics in Podiatric Medicine and Surgery, 3(4), 649-659.
Crossref
Google Scholar
PubMed
22. Ferris, D. P., Louie, M. & Farley, C. T. (1998). Running in the real world: adjusting leg stiffness for different surfaces. Proceedings of the Royal Society of London B: Biological Sciences, 265(1400), 989-994.
Crossref
Google Scholar
23. Grimston, S. K., Engsberg, J. R., Kloiber, R. & Hanley, D. A. (1991). Bone mass, external loads, and stress fracture in female runners. International Journal of Sport Biomechanics, 7(3), 293-302.
Crossref
Google Scholar
24. Hargrave, M. D., Carcia, C. R., Gansneder, B. M. & Shultz, S. J. (2003). Subtalar pronation does not influence impact forces or rate of loading during a single-leg landing. Journal of Athletic Training, 38(1), 18.
Crossref
Google Scholar
PubMed
25. He, J. P., Kram, R. & McMahon, T. A. (1991). Mechanics of running under simulated low gravity. Journal of Applied Physiology, 71(3), 863-870.
Crossref
Google Scholar
26. Hennig, E. M. & Lafortune, M. A. (1991). Relationships between ground reaction force and tibial bone acceleration parameters. International Journal of Sport Biomechanics, 7(3), 303-309.
Crossref
Google Scholar
27. Hewett, T. E., Lindenfeld, T. N., Riccobene, J. V. & Noyes, F. R. (1999). The effect of neuromuscular training on the incidence of knee injury in female athletes a prospective study. The American Journal of Sports Medicine, 27(6), 699-706.
Crossref
Google Scholar
28. Hortobágyi, T., Finch, A., Solnik, S., Rider, P. & DeVita, P. (2011). Asso- ciation between muscle activation and metabolic cost of walking in young and old adults. The Journals of Gerontology Series A: Biological Sciences and Medical Sciences, 66(5), 541-547.
Crossref
Google Scholar
29. Hyun, S. H. & Ryew, C. C. (2016). Relationship between dimensionless leg stiffness and kinetic variables during gait performance, and its modulation with body weight. Korean Journal of Sport Biomechanics, 26(3), 249-255.
Crossref
30. Kerdok, A. E., Biewener, A. A., McMahon, T. A., Weyand, P. G. & Herr, H. M. (2002). Energetics and mechanics of human running on surfaces of different stiffnesses. Journal of Applied Physiology, 92(2), 469-478.
Crossref
Google Scholar
31. Kuitunen, S., Komi, P. V., & Kyröläinen, H. (2002). Knee and ankle joint stiffness in sprint running. Medicine and Science in Sports and Exercise, 34(1), 166-173.
Crossref
Google Scholar
PubMed
32. Lipfert, S. W., Günther, M., Renjewski, D., Grimmer, S. & Seyfarth, A. (2012). A model-experiment comparison of system dynamics for human walking and running. Journal of Theoretical Biology, 292, 11-17.
Crossref
Google Scholar
33. Luhtanen, P. & Komi, P. V. (1980). Force-, power-, and elasticity-velocity relationships in walking, running, and jumping. European Journal of Applied Physiology and Occupational Physiology, 44(3), 279-289.
Crossref
Google Scholar
34. McMahon, T. A. & Cheng, G. C. (1990). The mechanics of running: how does stiffness couple with speed?. Journal of Biomechanics, 23, 65 -78.
Crossref
Google Scholar
PubMed
35. McMahon, T. A., Valiant, G. & Frederick, E. C. (1987). Groucho running. Journal of Applied Physiology, 62(6), 2326-2337.
Crossref
Google Scholar
PubMed
36. Mero, A. & Komi, P. V. (1986). Force-, EMG-, and elasticity-velocity relationships at submaximal, maximal and supramaximal running speeds in sprinters. European Journal of Applied Physiology and Occupational Physiology, 55(5), 553-561.
Crossref
Google Scholar
37. Plagenhoef, S. C., Evans, F. G. & Abdelnour, T. (1983). Anatomical data for analyzing human motion. Research Quarterly for Exercise and Sport, 54(2), 632-635.
Crossref
Google Scholar
38. Ryu, J. S. (2013). Effect of a prolonged-run-induced fatigue on the ground reaction force components. Korean Journal of Sport Biomechanics, 23(3), 225-233.
Crossref
Google Scholar
39. Ryu, J. S. (2014). Variability of GRF components between increased running times during prolonged run. Korean Journal of Sport Biomechanics, 24(4), 359-365.
Crossref
Google Scholar
40. Ryu, J. S. (2015). Impact shock components and attenuation in flat foot running. Korean Journal of Sport Biomechanics, 25(3), 283-291.
Crossref
Google Scholar
41. Schache, A. G., Blanch, P. D., Dorn, T. W., Brown, N. A., Rosemond, D. & Pandy, M. G. (2011). Effect of running speed on lower limb joint kinetics. Medicine and Science in Sports and Exercise, 43(7), 1260-1271.
Crossref
Google Scholar
PubMed
42. Seyfarth, A., Geyer, H., Günther, M. & Blickhan, R. (2002). A movement criterion for running. Journal of Biomechanics, 35(5), 649-655.
Crossref
Google Scholar
PubMed
43. Silder, A., Besier, T. & Delp, S. (2015). Running with a load increases leg stiffness. Journal of Biomechanics, 48(6), 1003-1008.
Crossref
Google Scholar
44. Steele, K. M., Seth, A., Hicks, J. L., Schwartz, M. S. & Delp, S. L. (2010). Muscle contributions to support and progression during single-limb stance in crouch gait. Journal of Biomechanics, 43(11), 2099-2105.
Crossref
Google Scholar
45. Stefanyshyn, D. J. & Nigg, B. M. (1998). Dynamic angular stiffness of the ankle joint during running and sprinting. Journal of Applied Biomechanics, 14(3), 292-299.
Crossref
Google Scholar
46. Taunton, J. E., Ryan, M. B., Clement, D. B., McKenzie, D. C., Lloyd-Smith, D. R. & Zumbo, B. D. (2002). A retrospective case-control analysis of 2002 running injuries. British Journal of Sports Medicine, 36(2), 95-101.
Crossref
Google Scholar
47. Taylor, C. R., Heglund, N. C. & Maloiy, G. M. (1982). Energetics and mechanics of terrestrial locomotion. I. Metabolic energy consump- tion as a function of speed and body size in birds and mammals. Journal of Experimental Biology, 97(1), 1-21.
Crossref
Google Scholar
48. Teunissen, L. P., Grabowski, A. & Kram, R. (2007). Effects of indepen- dently altering body weight and body mass on the metabolic cost of running. Journal of Experimental Biology, 210(24), 4418-4427.
Crossref
Google Scholar
PubMed
49. van Gent, B. R., Siem, D. D., van Middelkoop, M., van Os, T. A., Bierma-Zeinstra, S. S. & Koes, B. B. (2007). Incidence and determinants of lower extremity running injuries in long distance runners: a systematic review. British Journal of Sports Medicine, 41(9), 169-480.
Crossref
Google Scholar
50. Watson, M. D. (1987). Incidence of injuries in high school track and field athletes and its relation to performance ability. The American Journal of Sports Medicine, 15(3), 251-254.
Crossref
Google Scholar
51. Williams, P. T. (2009a). Lower prevalence of hypertension, hypercholesterolemia, and diabetes in marathoners. Medicine and Science in Sports and Exercise, 41(3), 523.
Crossref
Google Scholar
52. Williams, P. T. (2009b). Reduction in incident stroke risk with vigorous physical activity. Stroke, 40(5), 1921-1923.
Crossref
Google Scholar
PubMed
53. Wit, B. D., Clercq, D. D. & Lenoir, M. (1995). The effect of varying midsole hardness on impact forces and foot motion during foot contact in running. Journal of Applied Biomechanics, 11(4), 395-406.
Crossref
Google Scholar
