Open Access, Peer-reviewed
eISSN 2093-9752
Open Access, Peer-reviewed
eISSN 2093-9752
Jung Yee Kim
You Kyung Kim
Min Ji Son
Meoung Gon Lee
Jin Hee Kim
Chang Hong Youm
http://dx.doi.org/10.5103/KJSB.2016.26.3.293 Epub 2016 October 17
Abstract
Objective: The purpose of this study was to analyze the effects of freezing of gait and visual information on the static postural control ability in patients with Parkinson's Disease (PD) during the bipedal stance with feet together.
Method: This study included a total of 36 patients with PD; the freezer group included 17 PD patients (age: 69.3±6.2 yrs, height: 159.6±9.0 cm, weight: 63.4±9.78 kg) and the nonfreezer group included 19 PD patients (age: 71.4±5.6 yrs, height: 155.8±7.1 cm, weight: 57.7±8.6 kg). Static postural control ability was analyzed using variables of center of pressure (COP) and dividing by mediolateral, anteroposterior, and integration factors during a bipedal stance with the eyes open and closed.
Results: Freezers and nonfreezers showed increases in anteroposterior velocity, mediolateral velocity, averaged velocity, and mediolateral 95% edge frequency when visual information was blocked. Additionally, freezers had greater anteroposterior range, 95% confidence ellipse area, and COP anteroposterior mean position than nonfreezers.
Conclusion: Freezers and nonfreezers showed a reduction in static postural control ability when visual information was blocked. Additionally, the results of this study found a significant difference in static postural control ability between freezers and nonfreezers with PD. In particular, anteroposterior range, 95% confidence ellipse area, and COP anteroposterior mean position might be used to distinguish between freezers and nonfreezers with PD.
Keywords
Parkinson's disease Freezing of gait Center of pressure Balance Postural control
Parkinson's disease (PD), also known as paralysis agitans, is a disorder that causes degeneration of the central nervous system, with charac- teristic features of tremor or impaired muscle coordination (Parkinson, 2002; Jankovic, 2007; Bartels & Leenders, 2009). PD is the second most prevalent neurodegenerative disorder following Alzheimer's disease, with growing social and economic costs (de Lau & Breteler, 2006). Add- itionally, PD is known to affect about 0.3% of the entire population. The prevalence increases to 1% among the elderly population aged 60 years or older (Nussbaum & Ellis, 2003; de Lau & Breteler, 2006), with an annual incidence of 8~18 cases per 100,000 (de Lau & Breteler, 2006; Kim, Kim, & Lim, 2015). According to the Centers for Disease Control and Prevention, the prevalence of PD in Korea is about 28 cases per 100,000, and 16 cases per 100,000 of individuals aged 60 years or older. PD is more prevalent in women than in men, and is associated with a low survival rate (Centers for Disease Control & Prevention, 2008).
A key pathophysiological feature of PD is partial loss of dopaminergic neurons in the substantia nigra, which induces specific disruptions to the basal ganglia circuit (Moore, West, Dawson, & Dawson, 2005). Fur- thermore, PD results in an imbalance that disrupts the subcortico-cortical interaction, impairing relay functions at the level of the striatum (Bartels & Leenders, 2009). Clinical features of PD include tremor at rest, rigidity, bradykinesia, postural instability, and freezing of gait (Dauer & Przedborski, 2003). Freezing of gait (FOG) is an episodic gait distur- bance that presents in about 30~60% of all PD patients (Schaafsma et al., 2003), and refers to interruption of an effective gait as if the feet are glued to the ground (Giladi et al., 2000). If FOG occurs suddenly, secondary injuries such as fall due to loss of postural control can occur. About 90% of PD patients experience fall injuries (Błaszczyk, Orawiec, Duda-Kłodowska, & Opala, 2007) leading to reduced mobility and in- dependence, which in turn limits patients' social and economic lives and reduces quality of life (Bloem, Hausdorff, Visser, & Giladi, 2004; Moore, Peretz, & Giladi, 2007). Postural control requires an ability to combine sensory information with respect to the environment, and an ability to drive appropriate motor responses to control body move- ments. Sensory information for postural control includes vision, vesti- bular sense, proprioceptive sense, muscle strength, and reaction time (Sturnieks, George, & Lord, 2008). Acquiring deeper understanding of postural stability loss in cases of PD will be conducive to maintaining and enhancing the quality of life of PD patients.
A previous study that compared postural control in PD patients with healthy controls of the same age group reported that PD patients had lower postural control than the control group (Błaszczyk et al., 2007; Schmit et al., 2006). Błaszczyk et al. (2007) assessed postural control in 55 PD patients in Hoehn & Yahr stages 1~3 and 55 healthy controls of the same age group in a bipedal stance with feet together and eyes open and closed, and found that the PD patient group showed signifi- cantly greater mediolateral sway and sway area. Horak et al. (2005) assessed specific directionalities in postural instability in PD patients, and found low postural control with higher instability in all directions compared to that in the control group. In a study that examined pos- tural control in the presence of FOG and visual information in PD patients, Pelykh et al. (2015) reported that PD patients had lower pos- tural control than did the controls, regardless of the presence of FOG. The group with FOG had lower postural stability than the group without FOG when visual information was blocked. As previously mentioned, PD patients tend to show a decline in postural control, but data pertaining to the ability and features of postural control associated with FOG remain scarce. It is therefore necessary to examine the features of postural control in PD patients with and without FOG, and to analyze the differences in postural control in the presence or absence of visual information for better understanding of the disease.
The purpose of this study was to analyze the effects of freezing of gait and visual information on the ability to control static posture during bipedal stance with feet together in PD patients. Therefore, we propose the following hypothesis: Freezing of gait in patients with Parkinson's disease will affect their ability to control static posture, and blocking visual information will have a greater effect on PD patients with freezing of gait than on those without.
1. Participants
The study population consisted of 36 patients with Parkinson's disease and a Korean Mini-Mental Status Exam (K-MMSE) score of 24 or higher, who are outpatients at the neurology clinic at D University hospital without orthopedic, neurologic, or neurophysiologic histories affecting static postural control. We assessed the presence of FOG based on the New Freezing of Gait Questionnaire (NFOGQ) under the guidance of a neurology specialist at D University Hospital. Based on the results, 17 patients were assigned to the freezer group and 19 patients were assigned to the nonfreezer group. The Institutional Review Board at D University Hospital approved this study, and all participants provided informed consent (Table 1).
The experiment was conducted over two days. On the first day, patients underwent body composition analysis and filled out the in- formed consent form, history questionnaire, K-MMSE for measurement of cognitive function (Kwon & Park, 1989; Lee & Ko, 2010), NFOGQ for assessment of freezing of gait (Nieuwboer et al., 2009), and the Unified Parkinson's Disease Rating Scale (UPDRS) for assessment of the sever- ities of daily life disruptions and symptoms (Ahn, Ahn, & Park, 2009; Movement Disorder Society Task Force on Rating Scales for Parkinson's Disease, 2003). All patients were assessed with the Hoehn and Yahr Stage (H & Y) scale (Goetz et al., 2004), and underwent adaptation training for bipedal stance with feet together.
|
Freezers |
Nonfreezers |
t value |
|
|
Age
(years) |
69.29±6.15 |
71.44±5.62 |
.830 |
|
Height
(cm) |
159.56±9.00 |
155.81±7.06 |
.748 |
|
Body
weight (kg) |
63.36±9.77 |
57.66±8.60 |
1.309 |
|
Body
mass index |
24.78±2.45 |
23.71±2.90 |
1.109 |
1) NFOGQ
The NFOGQ verifies presence of freezing of gait in patients. After showing the patient or guardian a simple video clip illustrating the FOG phenomenon, items are scored that measure the frequency and duration of freeze episodes, and verify the effects of FOG on daily lives. A higher score indicates a higher FOG severity (Nieuwboer et al., 2009).
2) UPDRS
The UPDRS examines the severities of PD symptoms and disruptions of daily life. The first section measures mentation, behavior, and mood. The second section measures activities of daily living, the third measures motor functions, and the fourth measures medication complications. A higher score in each section indicates a higher disease stage (Ahn, Ahn, & Park, 2009; Movement Disorder Society Task Force on Rating Scales for Parkinson's Disease, 2003).
3) H & Y staging scale
The H & Y staging scale is a simple tool that determines the degree of PD progression. Stage 1 is defined as unilateral disease, 1.5 as uni- lateral and axial involvement, 2 as bilateral disease without impaired balance, 2.5 as mild bilateral disease with recovery on pull test, 3 as mild to moderate bilateral disease with postural instability and physical independence, 4 as severe disability but able to walk or stand unassisted, and 5 as wheelchair-bound or bedridden and unable to walk unless aided (Goetz et al., 2004).
On the second day, the subjects underwent bipedal stance with feet together testing with eyes closed and open. The PD patient group under- went the experiment after 12 hours of not taking their medications. The subjects’ clinical characteristics are shown in Table 2.
|
Freezers |
Nonfreezers |
t value |
|
|
History (years) |
10.7±5.8 |
5.4±5.4 |
2.790* |
|
NFOGQ (scores) |
12.8±5.9 |
- |
- |
|
UPDRS (scores) |
51.8±13.7 |
47.3±13.9 |
.979 |
|
UPDRS III (scores) |
35.0±8.9 |
34.5±9.0 |
.195 |
|
H & Y (stage) |
2.7±0.4 |
2.4±0.4 |
2.020 |
|
K-MMSE (scores) |
27.5±1.9 |
27.4±2.0 |
.250 |
2. Measurements
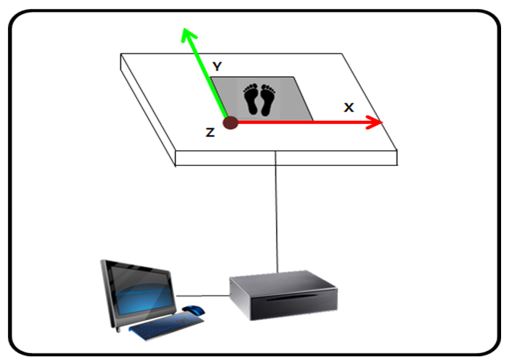
We installed a ground reaction force system in the laboratory. With the ground reaction force plate located in the left posterior point with reference to the subject as the starting point, the subject's mediolateral direction was set as the X-axis, anteroposterior direction as the Y-axis, and vertical direction as the Z-axis (Figure 1).
The subjects wore span t-shirts and shorts, and were barefoot when performing the bipedal stance with feet together and eyes closed and eyes open. To ensure safety and prevent injuries, shock absorption pads were placed around the force plates, and a neurology specialist and nurse from D University Hospital and the investigator were on standby.
For the bipedal stance with feet together and eyes either closed or open, the subjects were instructed to step on the force plate and stand stably. At the cue, they were to straighten out their knees and stand with both big toes and heels as close as possible. They were instructed to look forward and maintain the posture with minimal sway as long as possible. The subjects were to rest when they could no longer sustain the posture.
3. Data processing
The Nexus software (Vicon, UK) was used to synchronize, collect, and analyze the ground reaction force data for the bipedal stance with feet together and eyes closed and open. To eliminate the initial sway that may occur in experimental environments, only the data between 5~65 seconds following the start signal were analyzed. The data collected with a sampling frequency of 100 Hz were processed using a second order Butterworth low-pass filter with a cutoff frequency of 6 Hz (Dolye, Hsiao-Wecksler, Ragan, & Rosengren, 2007; Raymakers, Samson, & Verhaar, 2005; Oh, Youm, & Kim, 2011).
For analysis of the ground reaction force during bipedal stance with feet together and eyes closed or open, the trajectory of center of pres- sure (COP), a key variable that assesses postural control ability, was divided into temporal, frequency, and nonlinear domain variables to analyze the mediolateral, anteroposterior, and integration factors. The mediolateral and anteroposterior variables were distinguished using range, velocity, RMS (root mean squared) distance, total power frequency, spectral edge frequency 95 (SEF 95), spectral edge frequency 50 (SEF 50), and the Lyapunov exponent. The integration factor was distinguished using mean velocity, 95% confidence ellipse area, and mean antero- posterior position of COP.
Anteroposterior and mediolateral ranges of COP represent the dif- ference between the maximum and minimum values of anteroposterior and mediolateral positions of COP. Anteroposterior and mediolateral velocities of COP were computed separately for the anteroposterior direction and mediolateral direction, which were calculated by dividing the total anteroposterior and mediolateral displacement by the duration of analysis (T=60s). The mean velocity of COP was calculated by dividing the total displacement, regardless of direction of COP, by the duration of analysis (T=60s). The anteroposterior and mediolateral RMS distances of COP represent the square root of the mean of the squares of dis- placements to each direction, as shown in Equation 1 and Equation 2.
The area of the 95% confidence ellipse of COP encloses 95% of the COP trajectories, and represents the area of the COP point containing ellipses with radiuses of the major and minor axes (Equation 3).
For the frequency domain of COP, noise-filtered time series data were processed with Complexity version 2.0 (Laxtha, Korea), a nonlinear data analysis software, to analyze total frequency, SEF 95, and SEF 50. The frequency domain represents the number of vibrations per second. The total frequency of COP refers to the integral area derived from power spectral analysis; the spectral edge frequency 95 refers to the frequency in the 95% quantile of the power spectrum, and spectral edge frequency 50 refers to the frequency in the 50% quantile of the power spectrum (Youm, Park, & Seo, 2008).
For nonlinear analysis, the maximal Lyapunov exponent (MLE) was calculated by reconstructing the phase space with delay time and embedding dimension for each data. MLE represents the degree of divergence of the time series trajectories in a phase space (Park, Son, & Kim, 2007; Grassberger & Procaccia, 1983). The algorithm (Wolf et al., 1985) for the Lyapunov exponent is shown in Equation 4.
λ is the MLE, t is time interval, n is the number of time intervals, and d is the distance between two points (Park, Son, & Kim, 2007). To calculate the Lyapunov exponent, Chaos Data Analyzer software (pro- fessional version, Physics Academic Software, Sprott and Rowlands, 1998) was used to measure local stabilities.
4. Statistical analysis
The collected data were processed with SPSS (version 21.0, SPSS Inc, Chicago, IL) for statistics. Means and standard deviations were calculated, and the Shapiro-Wilk test was performed to verify normality of all data. To examine the main effects of visual information and groups (freezer and nonfreezer) as well as their interaction, two-way ANOVA was per- formed with repeated measures. An independent t test was used as a post hoc test to verify intergroup differences, and a paired sample t test was performed for post hoc verification of effects of visual information. Level of statistical significance was set to 0.05.
|
Eyes open |
Eyes closed |
Fa |
tc |
||
|
Range (cm) |
Freezer (n=17) |
3.51±1.26 |
3.25±1.05 |
.000 (V) |
.726 |
|
Nonfreezer (n=19) |
3.05±0.73 |
3.30±1.26 |
.506 (G) |
.975 |
|
|
tb |
1.369 |
.705 |
1.385 (V×G) |
||
|
Velocity (cm/s) |
Freezer (n=17) |
0.91±0.21 |
1.06±0.28 |
28.511 (V)* |
2.618* |
|
Nonfreezer (n=19) |
0.92±0.26 |
1.28±0.53 |
1.051 (G) |
4.838* |
|
|
tb |
.007 |
1.505 |
5.089 (V×G)* |
||
|
RMS distance (cm) |
Freezer (n=17) |
0.66±0.26 |
0.61±0.24 |
.008 (V) |
.966 |
|
Nonfreezer (n=19) |
0.56±0.18 |
0.60±0.16 |
.789 (G) |
1.035 |
|
|
tb |
1.405 |
.088 |
2.001 (V×G) |
||
|
Total power frequency (cm2) |
Freezer (n=17) |
0.47±0.35 |
0.38±0.34 |
.461 (V) |
1.312 |
|
Nonfreezer (n=19) |
0.34±0.22 |
0.38±0.19 |
.669 (G) |
.681 |
|
|
tb |
1.372 |
.049 |
2.207 (V×G) |
||
|
95% edge frequency (Hz) |
Freezer (n=17) |
0.72±0.33 |
0.82±0.32 |
10.334 (V)* |
1.453 |
|
Nonfreezer (n=19) |
0.79±0.24 |
0.99±0.33 |
1.702 (G) |
3.149* |
|
|
tb |
.745 |
1.551 |
1.189 (V×G) |
||
|
50% edge frequency (Hz) |
Freezer (n=17) |
0.11±0.06 |
0.13±0.10 |
2.376 (V) |
.961 |
|
Nonfreezer (n=19) |
0.12±0.08 |
0.15±0.13 |
.292 (G) |
1.250 |
|
|
tb |
.225 |
.581 |
.208 (V×G) |
||
|
Lyapunov exponent |
Freezer (n=17) |
0.06±0.02 |
0.06±0.02 |
13.013 (V)* |
1.083 |
|
Nonfreezer (n=19) |
0.06±0.02 |
0.07±0.02 |
.478 (G) |
4.516* |
|
|
tb |
.029 |
1.209 |
3.395 (V×G) |
||
1. The results of Mediolateral variables
Table 3 shows the mediolateral variables of COP. There was a main effect of visual information (F=28.511, p=.000) and interaction between group and visual information (F=5.089, p=.031) on mediolateral velocity. The post hoc test revealed that both the freezer (t=2.618, p=.019) and nonfreezer groups (t18=4.838, p=.000) showed significantly higher velocity when visual information was blocked.
There was a main effect of visual information on mediolateral SEF 95 (F=10.334, p=.003). The post hoc test revealed that freezers did not show significant differences in mediolateral SEF 95, while nonfreezers showed significantly greater mediolateral SEF 95 (t=3.149, p=.006) when visual information was blocked. Visual information had a main effect on the mediolateral Lyapunov exponent (F=13.013, p=.001). The post hoc test showed that nonfreezers had significantly higher medio- lateral Lyapunov exponents when visual information was blocked (t= 4.516, p=.000), while freezers did not show significant differences.
2. The results of anteroposterior variables
Table 4 shows the anteroposterior factors of COP trajectories. Although there were no main effects of visual information and group nor their interaction on anteroposterior range, the post hoc test revealed that freezers had significantly greater anteroposterior range (t=2.240, p=.032) than nonfreezers during bipedal stance with feet together and eyes open. Visual information had a main effect on anteroposterior velocity (F=25.734, p=.000). The post hoc test revealed that both the freezers (t=2.625, p=.018) and nonfreezers (t=4.537, p=.000) had significantly higher velocities when visual information was blocked. In addition, visual information had a main effect on anteroposterior SEF 95 (F=11.175, p=.002), and the post hoc test revealed that nonfreezers had signifi- cantly greater anteroposterior SEF 95 (t=2.758, p=.013) when visual information was blocked, while freezers did not show significant dif- ferences.
|
Eyes open |
Eyes closed |
Fa |
tc |
||
|
Range (cm) |
Freezer (n=17) |
3.78±1.32 |
3.32±0.81 |
0.056(V) |
1.418 |
|
Nonfreezer (n=19) |
2.99±0.72 |
3.19±0.99 |
2.942(G) |
.909 |
|
|
tb |
2.240* |
.431 |
2.956 (V×G) |
||
|
Velocity (cm/s) |
Freezer (n=17) |
1.00±0.26 |
1.17±0.18 |
25.734 (V)* |
2.625* |
|
Nonfreezer (n=19) |
0.88±0.25 |
1.20±0.44 |
.249 (G) |
4.537* |
|
|
tb |
1.391 |
.256 |
2.327 (V×G) |
||
|
RMS distance (cm) |
Freezer (n=17) |
0.70±0.28 |
0.67±0.15 |
.000 (V) |
.568 |
|
Nonfreezer (n=19) |
0.57±0.13 |
0.60±0.19 |
3.423 (G) |
.859 |
|
|
tb |
1.892 |
1.103 |
.945 (V×G) |
||
|
Total power frequency (cm2) |
Freezer (n=17) |
0.41±0.19 |
0.46±0.21 |
2.623 (V) |
1.112 |
|
Nonfreezer (n=19) |
0.33±0.16 |
0.40±0.24 |
1.522 (G) |
1.203 |
|
|
tb |
1.313 |
.865 |
.030 (V×G) |
||
|
95% edge frequency (Hz) |
Freezer (n=17) |
0.62±0.16 |
0.72±0.23 |
11.175 (V)* |
1.980 |
|
Nonfreezer (n=19) |
0.70±0.20 |
0.86±0.38 |
2.254 (G) |
2.758* |
|
|
tb |
1.416 |
1.369 |
.592 (V×G) |
||
|
50% edge frequency (Hz) |
Freezer (n=17) |
0.09±0.06 |
0.10±0.08 |
2.542 (V) |
.606 |
|
Nonfreezer (n=19) |
0.09±0.07 |
0.13±0.07 |
.391 (G) |
1.644 |
|
|
tb |
.066 |
.889 |
.571 (V×G) |
||
|
Lyapunov exponent |
Freezer (n=17) |
0.07±0.02 |
0.07±0.02 |
.091 (V) |
.590 |
|
Nonfreezer (n=19) |
0.06±0.02 |
0.07±0.03 |
.352 (G) |
.036 |
|
|
tb |
.447 |
.529 |
.058 (V×G) |
||
|
Eyes open |
Eyes closed |
Fa |
tc |
||
|
Averaged velocity (cm/s) |
Freezer (n=17) |
1.51±0.33 |
1.76±0.32 |
32.491 (V)* |
2.995* |
|
Nonfreezer (n=19) |
1.42±0.35 |
1.96±0.74 |
.137 (G) |
5.017* |
|
|
tb |
.789 |
1.013 |
4.238 (V×G)* |
||
|
95% confidence (cm2) |
Freezer (n=17) |
7.72±5.86 |
6.64±4.07 |
.003 (V) |
.834 |
|
Nonfreezer (n=19) |
4.21±2.46 |
5.38±3.88 |
4.411 (G)* |
1.148 |
|
|
tb |
2.392* |
.950 |
1.901 (V×G) |
||
|
COP anteroposterior (cm) |
Freezer (n=17) |
1.82±0.68 |
1.72±0.43 |
.002 (V) |
.640 |
|
Nonfreezer (n=19) |
1.40±0.31 |
1.51±0.60 |
4.882 (G)* |
.789 |
|
|
tb |
2.401* |
1.188 |
1.011 (V×G) |
||
3. The results of Integration variables
Table 5 shows the results of integration factors of COP trajectories. There was a main effect of visual information (F=32.491, p=.000) and interaction effect of visual information and group (F=4.238, p=.047) on mean velocity. In the post hoc test, both freezers (t=2.995, p=.009) and nonfreezers (t=5.017, p=.000) showed significantly higher velocities when visual information was blocked.
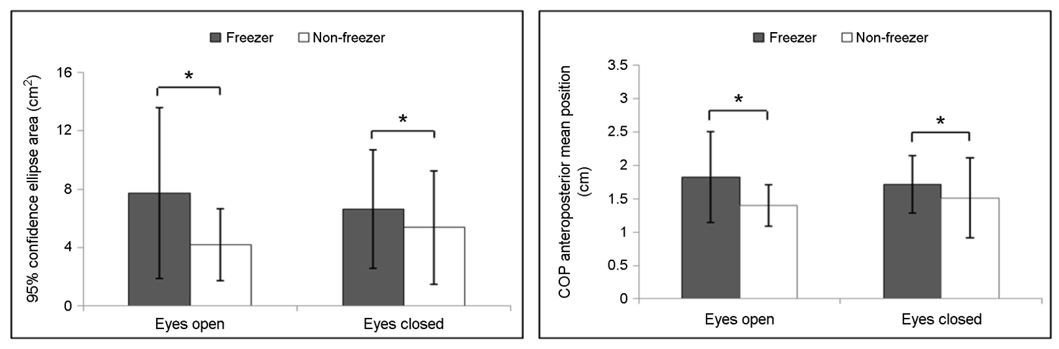
There was a main effect of group on area of 95% confidence ellipsis (F=4.411, p=.043). The post hoc test revealed that freezers had signifi- cantly higher 95% confidence ellipsis area than that of nonfreezers during bipedal stance with feet together and eyes open (t=2.392, p=.022). FOG had a main effect on mean position of anteroposterior COP (F=4.882, p=.034). The post hoc test revealed that freezers had significantly greater mean anteroposterior COP position than nonfreezers during bipedal stance with feet together eyes open (t=2.401, p=.022) (Figure 2).
The objective of this study was to analyze the effects FOG and visual information on PD patients' abilities to control static posture during bipedal stance with feet together. The results indicated that FOG impacts static postural control of PD patients, and blocking visual information affected PD patients regardless of presence of FOG.
1. Effects of visual information
Our findings showed that both freezers and nonfreezers displayed significantly greater mediolateral and anteroposterior velocities of COP when visual information was blocked. In terms of COP integration factors, freezers and nonfreezers showed significantly higher mean velocity when visual information was blocked. Blocking visual information was therefore found to weaken postural control ability in patients with PD, regardless of the presence of FOG.
Błaszczyk et al. (2007) analyzed postural control in accordance with presence or absence of visual information during a 30-second comfortable-width bipedal stance in 55 PD patients (H & Y stage: Ⅰ=12, Ⅱ=33, Ⅲ=10) and 55 healthy controls in the same age group. In their results, both the PD and control groups showed greater total distance, anteroposterior distance, anteroposterior range, and medio- lateral distance when visual information was blocked, and the PD group showed greater sway area, mediolateral range, and mean anteropos- terior position of COP. In an examination of the specific direction of sway with the greatest postural instability during narrow and wide stances in seven idiopathic PD patients and seven healthy controls in the same age group, Horak et al. (2005) found that both the PD patients and healthy controls had an increased stability margin when visual in- formation was blocked. Chastan et al. (2008) compared static postural control ability during bipedal stance with feet together in nine patients with early PD (H & Y stage: 1.22) and 18 healthy controls in the same age group after standardizing the position of the feet, and reported that both the PD and control groups had significantly increased antero- posterior and total distances. Pelykh et al. (2015) analyzed postural con- trol ability in accordance with presence or absence of visual information and freezing of gait during bipedal stance with feet together in 15 freezers with PD, 17 nonfreezers with PD, and 24 healthy people in the same age group. Their results showed that sway path increased in all groups when visual information was blocked. Similar to these findings, our results also indicated that freezers and nonfreezers are impacted by the absence of visual information, with reduced postural control ability when visual information is blocked. Based on our finding that mediolateral, anteroposterior, and mean velocities significantly increased when visual information was blocked, velocity could be a useful para- meter; the PD patient groups were influenced by the absence of visual information regardless of FOG. Potential factors that may induce fall injuries should be eliminated and lighting should be appropriately adjusted to ensure safety in clinical and daily living environments for PD patients. Intervention programs to enhance postural control ability should also be implemented.
2. Effects of freezing of gait
Freezers had significantly greater anteroposterior range and mean anteroposterior position of COP than nonfreezers during bipedal stance with feet together and eyes open. In terms of COP integration factors, freezers showed a significantly greater area of 95% confidence ellipse than that of nonfreezers during bipedal stance with feet together and eyes open.
Duncan et al. (2015) analyzed postural control ability in accordance with presence and absence of FOG using BESTest, Mini-BESTest, and BBS in 32 freezers and 46 nonfreezers. They found that freezers had weaker postural control ability than nonfreezers, which was speculated to be a result of the freezers’ postural reaction deficits in all directions while performing multiple tasks during gait. Vervoort et al. (2013) studied 9 freezers, 10 nonfreezers, and 10 healthy controls in the same age group to analyze postural control ability in accordance with presence and absence of FOG using sensory organization test, motor control test, and rhythmic weight shift test. In the rhythmic weight shift test, freezers had weaker directional control ability than did nonfreezers and healthy controls during voluntary weight shift, with particularly heightened deficit in anteroposterior control than mediolateral control. As shown in these studies, freezers have weakened postural control ability compared to nonfreezers during functional balance test. Although the degree of postural control deficit may vary in each direction, our finding that freezers exhibit weaker anteroposterior control ability is similar to that of Vervoort et al. (2013).
Błaszczyk et al. (2007) reported that the mean anteroposterior COP position was anteriorly displaced in PD patients compared to healthy controls in the same age group. Schiepatti & Nardone (1991) measured COP during bipedal stance with feet together and eyes open and closed in PD patients and healthy controls in the same age group. They re- ported that mean anteroposterior COP position was an important variable found in PD patients, where COP of PD patients who were less affected was posteriorly displaced and that of PD patients who were more affected was anteriorly displaced. Such deficits of anteroposterior control ability could cause secondary injuries, such as falls, when coupled with freezing of gait (Bloem, Hausdorff, Visser, & Giladi, 2004; Vervoort et al., 2013). Our results also showed that mean anteroposterior position of COP was greater in freezers than in nonfreezers, calling for additional studies to examine the correlation between reduced dynamic stability caused by anteroposterior control deficit and severity of PD.
Several studies compared static postural control ability in accordance with presence and absence of FOG in PD patients. In an analysis of postural control ability in accordance with visual information and FOG during bipedal stance with feet together in 15 freezers with PD, 17 nonfreezers with PD, and 24 healthy controls in the same age group, Pelykh et al. (2015) reported that PD patients had a significantly greater mean COP radius than healthy controls in bipedal stance with feet together and eyes open and that with eyes closed, and freezers with PD had a significantly greater mean COP radius than nonfreezers during bipedal stance with feet together eyes closed. These results are in line with our findings with regard to area of 95% confidence ellipses of COP. Several studies have been undertaken to examine static stability in accordance with FOG or that of PD patients while performing several tasks, but more data needs to be accumulated. Our findings showed that freezers had weaker static postural control ability than nonfreezers, suggesting that anteroposterior range, mean anteroposterior position, and area of 95% confidence ellipse of COP could be used as parameters to distinguish according to the presence and absence of FOG.
The linear analysis mentioned above could only provide information on the quantity of signals, and not movement variability in accordance with time (Harbourne & Stergiou, 2009). Variability provides flexible environmental adaptation strategies, which in turn provides various options for movement. A lack of variability induces abnormal mapping of the sensory cortex, hindering motor functions; such neural mapping (sensory and motor) is more complex with the presence of movement variability and less complex with reduced movement variability (Byl, Nagarajan, Merzenich, Roberts, & McKenzie, 2002); Harbourne & Stergiou, 2009; Nudo, Milliken, Jenkins, & Merzenich, 1996; Merzenich & Jenkins, 1993). Movement with optimal variability contributes to neuro- plasticity, which is essential for avoiding abnormal mapping and main- taining or accomplishing functions (Harbourne & Stergiou, 2009). The structure of variability could be explained through a nonlinear analysis performed with various parameters. The Lyapunov exponent is one of the nonlinear analysis parameters that measures dynamic local stability, which quantifies the divergence and convergence of trajectories early in the time series phase space. Local stability refers to the sensitivity of the natural sway that occurs while maintaining posture (Abarbanel, Gills, Liu, & Roy, 1996; Donker, Roerdink, Greven, & Beek, 2007; Lee & Youm, 2015). Pelykh et al. (2015) analyzed sample entropy, a nonlinear analysis method, in PD patients with FOG, PD patients without FOG, and healthy controls. Lower sample entropy values show higher regularity in move- ment, and higher sample entropy values show complexity. They found that PD groups had significantly lower sample entropy values than control groups during bipedal stance with feet together eyes closed and with eyes open. Based on this finding, they suggested that PD patients' postural control reflects their rigidity and low adaptability, attesting to their heightened risk for fall injuries. In our study, there were no significant differences in the Lyapunov exponent between the two groups, but both groups had a Lyapunov exponent of less than 0.1. This is speculated to result from a deterioration of variability caused by the characteristic rigidity in PD, which could in turn lead to deficits in static postural control ability. These findings suggest that FOG and ability to control static posture are significantly associated, which could be used as the basis to formulate criteria for clinical severity and to develop an intervention program. Based on our findings, future studies should assess various dynamic stabilities pertaining to gait or turning.
In conclusion, patients with Parkinson's disease showed reduced static postural control ability when visual information was blocked, regardless of presence or absence of freezing of gait. Anteroposterior COP velo- city, mediolateral COP velocity, and mean velocity have been found to verify the effects of blocking visual information. Furthermore, there were significant differences in anteroposterior COP range, mean anteropos- terior position, and 95% confidence ellipsis area in accordance with the presence and absence of FOG, suggesting that these variables could be used to determine the presence or absence of freezing of gait.
References
1. Abarbanel, H. D., Gills, Z., Liu, C. & Roy, R. (1996). Nonlinear-time-series analysis of chaotic laser dynamics. Physical Review A, 53(1), 440.
Crossref
Google Scholar
PubMed
2. Ahn, W. H., Ahn, J. S. & Park, E. K. (2009). The functional effect of multi- directional exercise program in Parkinson disease patients. Journal of Sport and Leisure Studies, 35(2), 791-799.
Crossref
3. Bartels, A. L. & Leenders, K. L. (2009). Parkinson's disease: the syndrome, the pathogenesis and pathophysiology. Cortex, 45(8), 915-921.
Crossref
Google Scholar
PubMed
4. Błaszczyk, J., Orawiec, R., Duda-Kłodowska, D. & Opala, G. (2007). Assess- ment of postural instability in patients with Parkinson's disease. Experimental Brain Research, 183(1), 107-114.
Crossref
Google Scholar
PubMed
5. Bloem, B. R., Hausdorff, J. M., Visser, J. E. & Giladi, N. (2004). Falls and freezing of gait in Parkinson's disease: a review of two intercon- nected, episodic phenomena. Movement Disorders, 19(8), 871-884.
Crossref
Google Scholar
PubMed
6. Byl, N. N., Nagarajan, S. S., Merzenich, M. M., Roberts, T. & McKenzie, A. (2002). Correlation of clinical neuromusculoskeletal and central somatosensory performance: variability in controls and patients with severe and mild focal hand dystonia. Neural Plasticity, 9(3), 177-203.
Crossref
Google Scholar
7. Centers for Disease Control & Prevention. (2008). Prevalence and re- search of Parkinson's disease. Centers for Disease Control & Pre- vention.
Crossref
8. Chastan, N., Debono, B., Maltête, D. & Weber, J. (2008). Discordance between measured postural instability and absence of clinical symptoms in Parkinson's disease patients in the early stages of the disease. Movement Disorders, 23(3), 366-372.
Crossref
Google Scholar
9. Dauer, W. & Przedborski, S. (2003). Parkinson's disease: mechanisms and models. Neuron, 39(6), 889-909.
Crossref
Google Scholar
PubMed
10. de Lau, L. M. & Breteler, M. (2006). Epidemiology of Parkinson's disease. The Lancet Neurology, 5(6), 525-535.
Crossref
Google Scholar
PubMed
11. Dolye, R. J., Hsiao-Wecksler, E. T., Ragan, B. G. & Rosengren, K. S. (2007). Generalizability of center of pressure measures of quiet standing. Gait & Posture, 25, 166-171.
Crossref
Google Scholar
PubMed
12. Donker, S. F., Roerdink, M., Greven, A. J. & Beek, P. J. (2007). Regularity of center-of-pressure trajectories depends on the amount of attention invested in postural control. Experimental Brain Research, 181(1), 1-11.
Crossref
Google Scholar
13. Duncan, R. P., Leddy, A. L., Cavanaugh, J. T., Dibble, L. E., Ellis, T. D., Ford, M. P. ... & Earhart, G. M. (2015). Balance differences in people with Parkinson disease with and without freezing of gait. Gait & Posture, 42(3), 306-309.
Crossref
Google Scholar
PubMed
14. Giladi, N., Shabtai, H., Simon, E. S., Biran, S., Tal, J. & Korczyn, A. D. (2000). Construction of freezing of gait questionnaire for patients with Parkinsonism. Parkinsonism and Related Disorders, 6(3), 165-170.
Crossref
Google Scholar
PubMed
15. Goetz, C. G., Poewe, W., Rascol, O., Sampaio, C., Stebbins, G. T., Counsell, C. & Seidl, L. (2004). Movement Disorder Society Task Force report on the Hoehn and Yahr staging scale: status and recommendations the Movement Disorder Society Task Force on rating scales for Parkinson's disease. Movement Disorders, 19(9), 1020-1028.
Crossref
Google Scholar
16. Grassberger, P. & Procaccia, I. (1983). Characterization of strange attractor. Physical Review Letters, 50, 346-349.
Crossref
Google Scholar
17. Harbourne, R. T. & Stergiou, N. (2009). Movement variability and the use of nonlinear tools: principles to guide physical therapist practice. Physical Therapy, 89(3), 267-282.
Crossref
Google Scholar
18. Horak, F. B., Dimitrova, D. & Nutt, J. G. (2005). Direction-specific pos- tural instability in subjects with Parkinson's disease. Experimental Neurology, 193(2), 504-521.
Crossref
Google Scholar
PubMed
19. Jankovic, J. (2007). Pathophysiology and assessment of parkinsonian symptoms and signs. In: Pahwa R, Lyons K, Koller WC, eds. Hand- book of Parkinson’ disease. New York: Taylor and Francis Group, LLC, 79-104.
Crossref
20. Kim, C. H., Kim, M. Y. & Lim, B. O. (2015). A Literature Review of Parkinson's Disease Rating, Balance, Fall and Gait Scales. Korean Journal of Sport Biomechanics, 25(4), 441-451.
Crossref
Google Scholar
21. Kwon, Y. C. & Park, J. H. (1989). Standardization of korean version of the Mini-Mental State Examination (MMSE-K) for Use in the Elderly. Part Ⅱ. Diagnostic Validity. The Korean Neuropsychiatric Association, 28(3), 508-513.
Crossref
22. Lee, D. J. & Ko, T. S. (2010). Relationships between symptoms of de- pression and cognitive function, physical functions, and activities of dailyliving in stroke patients. Journal of Special Education & Rehabilitation Science, 49(4), 159-178.
Crossref
23. Lee, K. H. & Youm, C. H. (2015). Comparison of Taekwondo Levels and Gender Differences on Postural Control Ability in the Elementary Students Using Nonlinear Analysis. The Korean Journal of Physical Education-Natural Science, 54(3), 551-562.
Crossref
24. Merzenich, M. M. & Jenkins, W. M. (1993). Reorganization of cortical representations of the hand following alterations of skin inputs in- duced by nerve injury, skin island transfers, and experience. Journal of Hand Therapy, 6(2), 89-104.
Crossref
Google Scholar
25. Moore, O., Peretz, C. & Giladi, N. (2007). Freezing of gait affects quality of life of peoples with Parkinson's disease beyond its relationships with mobility and gait. Movement Disorders, 22(15), 2192-2195.
Crossref
Google Scholar
PubMed
26. Moore, D. J., West, A. B., Dawson, V. L. & Dawson, T. M. (2005). Molecular pathophysiology of Parkinson's disease. Annual Review of Neuro- science, 28, 57-87.
Crossref
Google Scholar
PubMed
27. Movement Disorder Society Task Force on Rating Scales for Parkinson's Disease. (2003). The Unified Parkinson's Disease Rating Scale (UPDRS): status and recommendations. Movement Disorders, 18(7), 738.
Crossref
PubMed
28. Nieuwboer, A., Rochester, L., Herman, T., Vandenberghe, W., Emil, G. E., Thomaes, T. & Giladi, N. (2009). Reliability of the new freezing of gait questionnaire: agreement between patients with Parkinson's disease and their carers. Gait & Posture, 30(4), 459-463.
Crossref
Google Scholar
PubMed
29. Nudo, R. J., Milliken, G. W., Jenkins, W. M. & Merzenich, M. M. (1996). Use-dependent alterations of movement representations in primary motor cortex of adult squirrel monkeys. Journal of Neuroscience, 16(2), 785-807.
Crossref
Google Scholar
30. Nussbaum, R. L. & Ellis, C. E. (2003). Alzheimer's disease and Parkinson's disease. New England Journal of Medicine, 348(14), 1356-1364.
Crossref
Google Scholar
PubMed
31. Oh, H. J., Youm, C. H. & Kim, T. H. (2011). Effects of Exercise-Induced Fatigue and Blocked Vision on Postural Control during Upright Stance. Korean Journal of Sport Biomechanics, 21(3), 353-359.
Crossref
Google Scholar
32. Parkinson, J. (2002). An Essay on the Shaking Palsy. Journal of Neuro- psychiatry, 14(2), 223-236.
Crossref
Google Scholar
PubMed
33. Park, J. H., Son, K. & Kim, K. H. (2007). Chaos Analysis of Major Joint Motions for Young Males During Walking. Transactions of the Korean Society of Mechanical Engineers A, 31(8), 889-895.
Crossref
Google Scholar
34. Pelykh, O., Klein, A. M., Bötzel, K., Kosutzka, Z. & Ilmberger, J. (2015). Dynamics of postural control in Parkinson patients with and without symptoms of freezing of gait. Gait & Posture, 42(3), 246-250.
Crossref
Google Scholar
PubMed
35. Raymakers, J. A., Samson, M. M. & Verhaar, H. J. J. (2005). The assess- ment of body sway and the choice of the stability parameter(s). Gait & Posture, 21(1), 48-58.
Crossref
Google Scholar
PubMed
36. Schaafsma, J. D., Balssh, Y., Gurevich, T., Bartels, A. L., Hausdorff, J. M. & Giladi, N. (2003). Characterization of freezing of gait subtypes and the response of each to levodopa in Parkinson's disease. European Journal of Neurology, 10(4), 391-398.
Crossref
Google Scholar
PubMed
37. Schieppati, M. & Nardone, A. (1991). Free and supported stance in Parkinson's disease. Brain, 114(3), 1227-1244.
Crossref
Google Scholar
PubMed
38. Sturnieks, D. L., St George, R. & Lord, S. R. (2008). Balance disorders in the elderly. Neurophysiologie Clinique/Clinical Neurophysiology, 38(6), 467-478.
Crossref
Google Scholar
PubMed
39. Schmit, J. M., Riley, M. A., Dalvi, A., Sahay, A., Shear, P. K., Shockley, K. D. & Pun, R. Y. (2006). Deterministic center of pressure patterns characterize postural instability in Parkinson's disease. Experimental Brain Research, 168(3), 357-367.
Crossref
Google Scholar
40. Vervoort, G., Nackaerts, E., Mohammadi, F., Heremans, E., Verschueren, S., Nieuwboer, A. & Vercruysse, S. (2013). Which aspects of postural control differentiate between patients with Parkinson's disease with and without freezing of gait?. Parkinson's Disease, 2013.
Crossref
Google Scholar
41. Wolf, A., Swift, J. B., Swinney, H. L. & Vastano, J. A. (1985). Determining Lyapunov exponents from a time series. Physica D: Nonlinear Phe- nomena, 16(3), 285-317.
Crossref
Google Scholar
42. Youm, C. H., Park, Y. H. & Seo, K. W. (2008). Assessment of Single-leg Stance Balance Using COP 95% Confidence Ellipse Area. Korean Journal of Sport Biomechanics, 18(2), 19-27.
Crossref
Google Scholar
