Open Access, Peer-reviewed
eISSN 2093-9752
Open Access, Peer-reviewed
eISSN 2093-9752
Ho-Jong Gil
Sukhoon Yoon
10.5103/KJAB.2025.35.4.341 Epub 2026 January 13
Abstract
Objective: The purpose of this study was to compare the kinematic characteristics of the foot segment between high-power and low-power pedaling groups in female cyclists, using functional biomechanical event points.
Method: The study participants were 12 female road cyclists. They were divided into a high-power group (HPG, n=6; age: 29.6 ± 5.7 yrs., height: 163.8 ± 6.6 cm, body weight: 58.1 ± 4.8 kg, power output: 261.3 ± 31.8 W, power-to-weight ratio: 4.5 ± 0.5 W/kg) and a low-power group (LPG, n=6; age: 33.3 ± 12.1 yrs., height: 162.6 ± 7.4 cm, body weight: 56.1 ± 5.3 kg, power output: 167.5 ± 26.3 W, power-to-weight ratio: 3.0 ± 0.4 W/kg) according to the 5-minute functional threshold power output (≥200 W or <200 W). Three-dimensional kinematic data were collected using a nine-camera motion capture system (100 Hz) during pedaling on a stationary smart trainer. The pedal cycle was segmented based on functional event points: E1 (30°), E2 (150°), E3 (210°), and E4 (330°). Foot segment angle (FSA), angular velocity (FSAV), and angular acceleration (FSAA) were analyzed at each event point and within each phase (P1-P4).
Results: First, no significant differences were observed between groups in FSA, range of motion, or angular velocity at any event point or phase. Second, the maximum angular acceleration during the main propulsive phase (P1: 30-150°) was significantly greater in HPG than in LPG (p<.05, d=1.808). Third, the angular acceleration at E2 (150°) was significantly greater in HPG than in LPG (p<.05, d=1.321). Both variables showed large effect sizes.
Conclusion: The kinematic distinction between high-power and low-power pedaling in female cyclists was more evident in foot segment angular acceleration than in angular position or velocity. These findings suggest that training interventions targeting rapid foot segment acceleration during the early propulsive phase may enhance pedaling efficiency in recreational cyclists.
Keywords
Cycling biomechanics Foot segment kinematics Angular acceleration Power output Functional event analysis
사이클은 경쟁 스포츠와 건강 증진 활동으로서 그 중요성이 지속적으로 증대되어 왔다(Götschi, Garrard & Giles-Corti, 2016). 전 세계 사이클 인구는 지난 10년간 증가하였으며, 특히 코로나19 기간 동안 사이클 참여율은 상승세를 보였다(Buehler & Pucher, 2021). 사이클 경기력의 핵심 결정 요인 중 하나인 페달링 효율성은 발-페달 인터페이스에서의 운동학적 최적화에 크게 의존하는 것으로 알려져 왔다(FitzGibbon, Vicenzino & Hough, 2016). 실제로 와트 출력의 차이는 장거리 경기에서 최종 기록에 격차를 발생시킬 수 있다는 보고는, 발분절 움직임의 역학적 차이가 경기 결과에 영향을 미칠 수 있음을 시사한다(Atkinson, Peacock, St Clair Gibson & Tucker, 2007). 국제 수준에서 경쟁하는 숙련된 사이클 선수들은 최적화된 페달링 패턴을 보유하고 있으며, 이들이 200 W에서 발휘하는 출력은 정교한 신경근 협응의 결과로 이해된다(Takaishi, Yamamoto, Ono, Ito & Moritani, 1998). 부적절한 발분절 사용 패턴은 만성적인 전방 무릎 통증 및 슬개건 손상과 연관될 수 있다는 점이 지적되어 왔다(Bailey, Maillardet & Messenger, 2003). 이러한 맥락에서 출력 수준에 따른 사이클 페달링 시 발분절의 운동학적 메커니즘을 규명하는 것은 경기력 향상과 부상 예방이라는 실질적 요구에 부응하기 위한 필수적 과제라 할 수 있다.
사이클에서 페달링 효율성과 발분절의 생체역학적 특성 간의 관계에 대해서는 그동안 다양한 연구가 수행되어 왔다. 페달링 효율성이 발목 관절의 각도 변화 패턴과 밀접한 관련이 있음이 보고되었으며(Leirdal & Ettema, 2011), 파워 출력 증가에 따라 발목 관절의 운동학적 변인에 유의미한 변화가 발생함이 관찰되었다(Holliday, Theo, Fisher & Swart, 2023). 이론적 측면에서 페달링 중 발분절의 움직임이 중추신경계의 운동제어 전략을 반영한다고 제안되었으며(Wakeling & Horn, 2009), 페달링 강도 변화에 따른 신경근 적응 패턴이 발분절의 운동학적 변화로 나타날 수 있음이 시사되었다. 이러한 연구들은 페달링 강도와 발분절 움직임 간의 관계에 대한 이해를 넓히는 데 기여하였으나, 대부분 페달 회전 주기를 0-90°, 90-180°, 180-270°, 270-360° 등 기하학적으로 균등한 구간(quadrants)으로 분할하여 분석함으로써(Carpes, Dagnese, Mota & Stefanyshyn, 2009; Holliday et al., 2023), 실제 페달링 역학에서 기능적으로 의미 있는 이벤트 시점을 반영하지 못하는 한계를 보였다.
기존 연구의 근본적 제한점은 페달 회전 주기의 분석 구간이 역학적 이벤트가 아닌 기하학적 편의에 기반하여 설정되어 왔다는 데 있다. 페달링 동작에서 실제 힘 생성은 상사점(0°)이 아닌 30° 지점에서 본격적으로 시작되며, 150° 부근에서 추진력 생성이 종료되고 210° 지점에서 회복 구간으로 전환된다(Dorel et al., 2010). 330° 부근에서는 다음 추진 구간을 위한 준비 동작이 이루어지며, 이 구간에서의 발목 각도 조절이 후속 힘 전달의 효율성을 좌우한다고 알려져 있다(Millour et al., 2020). 그러나 기존 연구들은 기하학적 분할에 의존함으로써 이러한 기능적 전환 시점에서의 발분절 움직임 특성을 정밀하게 포착하지 못했다(Dorel et al., 2010; Hug, Drouet, Champoux, Couturier & Dorel, 2008). 선행연구에 따르면 200 W 전후의 출력 수준은 기술적 차이가 관찰되면서도 일관된 페달링 패턴이 유지되는 임계 구간으로 간주될 수 있다고 보고된 바 있다(García-López, Díez-Leal, Ogueta-Alday, Larrazabal & Rodríguez-Marroyo, 2016). 아울러 안장 높이와 라이딩 조건에 따른 하지관절 분석에서 엉덩 및 무릎관절보다 발목관절에서 운동학적 차이가 두드러지게 관찰되었다는 보고는 발분절 움직임이 출력 수준과 기술적 숙련도를 반영하는 민감한 지표일 가능성을 시사한다(Bini et al., 2010; Millour et al., 2020).
따라서, 본 연구의 목적은 국가대표를 포함한 엘리트 수준의 고출력(200 W 이상) 페달링 집단과 동호인 수준의 저출력(200 W 미만) 페달링 집단 간의 발분절 운동학적 차이를 페달링 역학의 기능적 이벤트 구간(30°, 150°, 210°, 330°)별로 정밀하게 분석하고, 시상면에서의 발분절각, 각속도 및 각가속도 변화 양상이 각 이벤트 구간 및 출력 수준에 따라 어떠한 특성을 보이는지를 규명하는 것이다. 이를 통해 정점 수준 선수들의 효율적 페달링 기술이 갖는 운동학적 특성을 이해하고, 동호인 사이클리스트의 기술 향상을 위한 구체적인 개입 지점을 제시하고자 한다.
1. 연구대상
본 연구를 위하여 최근 3개월 내 하지 부상 및 수술 경험이 없으며, 로드 사이클 대회 참여 경력이 있는 성인 여성 12명이 모집되었다. 그 중 고강도 페달링을 수행하는 집단 6명과 저강도 페달링을 주로 수행하는 집단 6명을 대상으로 하였다. 고강도 페달링 집단(High Power Group [HPG])은 당시 여성 국가대표 로드 사이클 선수 3명이 포함된 집단(당시 아시아 랭킹 1위 포함)으로 5분간 FTP 와트 출력이 평균 200 W 이상인 대상자로 구분하였다(나이: 29.6±5.7세, 신장: 163.8±6.6 cm, 체중: 58.1±4.8 kg, 인심 길이: 75.2±3.1 cm, 와트 출력: 261.3±31.8 W, 체중 대비 파워: 4.5±0.5 W/kg). 저강도 페달링 집단(Low Power Group [LPG])에는 로드 사이클 경력이 3년 이상이며, 5분간의 FTP에서 와트 출력이 평균 100 W를 초과하고 200 W 미만인 6명으로 구성되었다(나이: 33.3±12.1세, 신장: 162.6±7.4 cm, 체중: 56.1±5.3 kg, 인심 길이: 75.9±3.5 cm, 와트 출력: 167.5±26.3 W, 체중 대비 파워: 3.0±0.4 W/kg). 모든 참여자들은 연구 목적과 방법에 대한 모집공고를 확인하여 자발적으로 참여하였으며, 모든 절차 및 안전상태에 대한 안내문을 확인한 후 자발적 의사에 의해 동의서를 작성하였다.
2. 실험절차
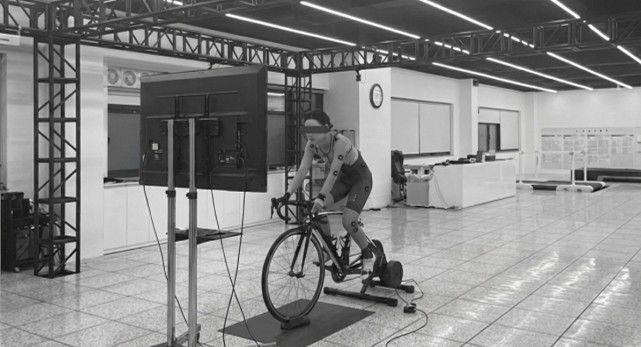
연구 대상자의 페달링 동작 변화를 분석하기 위하여 와후키커(Wahoo KICKR) 고정 스마트 롤러에 개인 사이클을 고정하고, 전면에 설치된 모니터에 즈위프트(Zwift) 소프트웨어와 파워미터를 연동하여 실시간으로 변화하는 파워 출력을 모니터링하였다(Figure 1). 안장 높이는 각 대상자가 평소 선호하는 높이로 설정하도록 하였다(Bini & Priego-Quesada, 2022). 3차원 운동학적 데이터 수집을 위해 적외선 모션캡처 카메라 9대(Oqus 300, Qualisys, Sweden)를 실험실 내에 배치하여 반사마커의 공간 좌표를 추적하였으며, 촬영 속도는 100 Hz로 설정하였다(Evans, Ballhause, James, Rowlands & Lee, 2021). 피험자 개인의 페달링 강도 설정은 즈위프트 소프트웨어에서 제공하는 5분간 FTP 측정 프로토콜을 선택하여(Borszcz, Tramontin & Costa, 2020), 피험자 스스로가 5분 동안 최대 파워로 유지할 수 있는 자율적인 움직임으로 진행하도록 하였다. 분석 구간은 FTP 측정 시작 후 파워 출력이 최대 양의 변곡점(maximum positive inflection point)에 도달하는 초기 가속 구간을 제외하고, 이후 안정화된 파워 출력이 유지되는 시점부터 5분 종료 시점까지로 설정하였다. 이를 통해 초기 과도기(transient phase)의 불안정한 페달링 패턴을 배제하고, 목표 강도를 지속적으로 유지하려는 정상상태(steady-state) 페달링 동작의 평균적 특성을 분석하였다.
3. 자료처리 및 분석방법
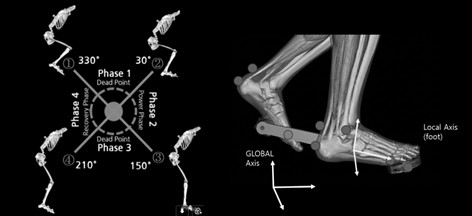
본 연구에서는 Qualisys Track Manager (Qualisys, Sweden)와 Project Automation Framework (PAF) Module의 전신 마커 세팅을 적용하여 반사마커의 위치 좌표를 수집하였으며, 이로부터 하지관절 각도를 개별 추출하였다. 수집된 데이터는 Visual3D (HAS-Motion Inc., USA)로 이관하여 4차 Butterworth 저역통과 필터를 영위상(zero-lag) 방식으로 적용하였으며(Robertson & Dowling, 2003), 차단주파수는 사이클링 운동학 분석에 관한 선행연구에 기반하여 10 Hz로 설정하였다(Bini, Tamborindeguy & Mota, 2010; Momeni, Faghri & Evans, 2014). 이후 페달 회전 주기 내 특정 이벤트 및 구간별 분석을 위해 MATLAB R2016a (The MathWorks, USA)로 데이터를 이관하여 2차 계산 처리를 수행하였다. 페달 회전 주기는 크랭크 암이 상사점(Top Dead Center, 0°)에서 시작하여 360° 회전 후 다시 상사점으로 돌아오는 구간으로 정의하였다. 본 연구에서는 기존 연구들이 채택한 기하학적 균등 분할(90°, 180°, 270°; Bertucci, Grappe, Girard, Betik & Rouillon, 2005) 대신, 페달링 역학에서 기능적으로 의미 있는 이벤트 시점을 기준으로 분석 구간을 설정하였다. 구체적으로, 실효 추진력이 생성되기 시작하는 30° 지점을 E1, 추진력 생성이 종료되는 150° 지점을 E2, 회복 구간으로 전환되는 210° 지점을 E3, 다음 추진 구간을 위한 준비 동작이 이루어지는 330° 지점을 E4로 정의하였다(Dorel et al., 2010; Bourke, 2017). 이러한 4개의 이벤트 시점을 경계로 페달 회전 주기를 4개 구간으로 분할하여, E1에서 E2까지의 주 추진 구간을 P1 (30-150°), E2에서 E3까지의 추진-회복 전환 구간을 P2 (150-210°), E3에서 E4까지의 주 회복 구간을 P3 (210-330°), E4에서 다음 주기의 E1까지의 회복-추진 전환 구간을 P4 (330-30°)로 설정하였다(Figure 2).
4. 분석변인
본 연구에서 분석한 발분절각(foot segment angle, FSA)은 공간 켈리브레이션에 의해 정의된 전역 좌표계(Global axis)와 동작 수행 중 각 프레임에서 재계산된 지역 좌표계 간의 회전 행렬 차이로부터 Cardan 각도 분해 방식을 적용하여 최종 분절 각도를 도출하였다(Hamill & Knutzen, 2006; Winter, 2009). Cardan 각도는 시상면-관상면-수평면 순(X-Y-Z)의 회전 순서를 사용하여 계산하였다. 본 연구에서는 클릿이 페달에 고정되어 내-외번(inversion-eversion) 및 내-외전(adduction-abduction)이 제약되는 특성을 고려하여(Gregersen & Hull, 2006), 시상면에서의 운동학적 변화만을 분석하였으며, 배측굴곡 방향을 양(+)의 값, 저측굴곡 방향을 음(-)의 값으로 정의하였다(Hamill, Knutzen & Derrick, 2015; Winter, 2009). 분석 변인으로는 각 이벤트 시점(E1-E4)에서의 발분절각(FSA), 발분절 각속도(foot segment angular velocity, FSAV), 발분절 각가속도(foot segment angular acceleration, FSAA)를 산출하였으며, 각 구간(P1-P4)에서는 발분절 가동범위(foot segment range of motion, FS_RoM)와 구간 내 최대 각속도(MFSAV) 및 최대 각가속도(MFSAA)를 산출하였다.
5. 통계처리
수집된 데이터의 통계 분석은 SPSS Statistics (version 22.0, IBM Corp., USA)를 사용하여 수행하였으며, 기술통계량으로 평균과 표준편차를 산출하였다. 고강도 페달링 집단과 저강도 페달링 집단 간의 발분절 운동학적 변인 차이를 검증하기 위해 독립표본 t-검정(independent samples t-test)을 실시하였다. 분석에 앞서 Shapiro-Wilk 검정을 통해 정규성 가정을, Levene 검정을 통해 등분산 가정을 확인하였으며(Hoekstra, Kiers & Johnson, 2012), 두 가지 가정이 모두 충족되는 것을 확인하였다. 모든 검정의 유의수준은 α=.05로 설정하였다. 집단 간 차이의 실질적 의미를 해석하기 위해 효과크기로 Cohen's d를 산출하였으며, 해석 기준은 Cohen (1988)의 권고에 따라 |d|<0.5를 작은 효과, 0.5≤|d|<0.8을 중간 효과, |d|≥0.8을 큰 효과로 분류하였다(Lakens, 2013). 한편, 본 연구의 주된 분석은 두 집단 간 차이 검증이나, 집단 간 유의한 차이가 관찰된 변인에 대해서는 그 역학적 의미를 심층적으로 해석하기 위해 Pearson 적률상관분석을 탐색적으로 실시하였으며(Ditroilo, Mesquida, Abt & Harper, 2025), 해당 결과는 논의에서 보조적 자료로 제시하였다.
본 연구에서 사이클 200 W를 기준으로 고강도(200 W 이상) 페달링 집단과 저강도(200 W 이하) 페달링 집단 간에 발분절의 각도 변화 및 각속도, 각가속도를 비교한 결과는 <Table 1-3>과 같다. 우선, 주요 순간의 발분절각과 구간별 발분절 가동범위는 집단 간에 통계적인 차이가 없었으며, 주요 순간의 발분절 각속도와 구간별 최대 각속도도 집단간에 통계적인 차이가 없었다. 그러나 고강도 페달링 집단의 발분절 최대 각가속도는 1구간(사점: 배측굴곡에서 저측굴곡 전환 구간)과 파워를 내기 시작하는 시점(E2: end point of P1)에서 저강도 페달링 집단에 비하여 통계적으로 크게 나타났으며(p<.05), 두 변인 모두 큰 효과크기를 보였다(MFSAA at P1: d=1.808; FSAA at E2: d=1.321).
|
Variables |
HPG |
LPG |
t value |
p value |
Effect size (Cohen' d) |
|
FSA at E1 |
-39.0±5.0 |
-42.9±1.9 |
1.478 |
0.085 |
1.031 |
|
FSA at E2 |
-12.1±6.9 |
-18.7±4.1 |
1.732 |
0.057 |
1.158 |
|
FSA at E3 |
-11.4±3.1 |
-13.3±5.8 |
0.765 |
0.231 |
0.412 |
|
FSA at E4 |
-29.6±4.0 |
-31.6±3.8 |
0.836 |
0.211 |
0.517 |
|
FS_RoM at P1 |
24.3±3.6 |
21.6±4.3 |
1.190 |
0.131 |
0.701 |
|
FS_RoM at P2 |
13.3±2.1 |
15.5±3.0 |
-1.463 |
0.087 |
0.836 |
|
FS_RoM at P3 |
14.4±3.2 |
14.7±3.3 |
-0.163 |
0.437 |
0.100 |
|
FS_RoM at P4 |
18.3±1.9 |
17.7±2.3 |
0.487 |
0.319 |
0.286 |
|
HPG: high power group, LPG: low power group, FSA: foot segment
angle, FS_RoM: foot segment's range of motion, (+): dorsiflexion angle,
(-): plantarflexion angle *Indicates statistically significant difference between groups |
|||||
|
Variables |
HPG |
LPG |
t value |
p value |
Effect size (Cohen' d) |
|
FSAV at E1 |
215.0±59.1 |
179.5±78.5 |
0.885 |
0.199 |
0.511 |
|
FSAV at E2 |
241.0±37.1 |
257.9±73.1 |
-0.545 |
0.299 |
0.292 |
|
FSAV at E3 |
-160.6±38.9 |
-170.4±72.2 |
0.310 |
0.381 |
0.168 |
|
FSAV at E4 |
-193.5±37.2 |
-179.9±33.1 |
-0.618 |
0.275 |
0.387 |
|
MFSAV at P1 |
283.7±43.6 |
267.1±72.5 |
0.503 |
0.313 |
0.268 |
|
MFSAV at P2 |
-167.7±33.8 |
-155.5±75.4 |
-0.400 |
0.349 |
0.209 |
|
MFSAV at P3 |
-197.3±35.6 |
-202.4±55.6 |
0.197 |
0.424 |
0.110 |
|
MFSAV at P4 |
171.2±53.0 |
132.9±59.1 |
1.140 |
0.140 |
0.682 |
|
HPG: high power group, LPG: low power group, FSAV: foot segment angular velocity,
MFSAV: Maximum foot segment angular velocity *Indicates statistically significant difference
between groups |
|||||
|
Variables |
HPG |
LPG |
t value |
p value |
Effect size (Cohen' d) |
|
FSAA at
E1 |
1821.4±248.9 |
1990.3±854.8 |
-0.538 |
0.301 |
0.278 |
|
FSAA at
E2 |
-1752.4±961.4 |
-756.0±459.2 |
-1.931 |
0.041* |
1.321 |
|
FSAA at
E3 |
-108.5±849.7 |
-408.0±725.6 |
0.600 |
0.281 |
0.379 |
|
FSAA at
E4 |
-180.6±596.1 |
6.7±635.8 |
-0.503 |
0.313 |
0.304 |
|
MFSAA
at P1 |
-1051.3±402.5 |
-462.5±223.9 |
-2.682 |
0.011* |
1.808 |
|
MFSAA
at P2 |
-3453.4±893.6 |
-3818.0±1208.0 |
0.596 |
0.282 |
0.343 |
|
MFSAA
at P3 |
515.5±420.1 |
563.0±561.1 |
-0.166 |
0.436 |
0.096 |
|
MFSAA
at P4 |
3376.4±964.7 |
3332.5±1829.6 |
0.056 |
0.478 |
0.030 |
|
HPG: high power group, LPG: low power group, FSAA: foot
segment angular acceleration, MFSAA: maximum foot segment angular
acceleration, (+): dorsiflexion angular acceleration, (-): plantarflexion angular acceleration *Indicates statistically significant difference between
groups |
|||||
본 연구는 여성 엘리트 사이클 선수를 포함한 고출력(200 W 이상) 페달링 집단과 동호인 수준의 저출력(200 W 미만) 페달링 집단 간에 발분절의 운동학적 특성을 비교하였다. 기존 연구들이 채택해 온 기하학적 균등 분할(90°, 180°, 270°) 대신(Bertucci et al., 2005), 페달링 역학에서 기능적으로 의미 있는 이벤트 시점(E1: 30°, E2: 150°, E3: 210°, E4: 330°)을 기준으로 분석을 수행하였다(Dorel et al., 2010). 페달링 속도와 강도가 증가할수록 발목관절의 역할이 중요해진다는 선행연구에 기반하여(Aasvold, Ettema & Skovereng, 2019), 본 연구가 발분절의 운동학적 변인에 초점을 맞춘 것은 출력 수준에 따른 페달링 기술 차이를 규명하는 데 적절한 접근이었다고 판단된다(Bini et al., 2010).
본 연구 결과, 각 이벤트 시점(E1-E4)에서의 발분절각과 각 구간(P1-P4)에서의 발분절 가동범위는 집단 간에 통계적으로 유의한 차이가 나타나지 않았다. 주 추진 구간인 P1 (30-150°)에서의 가동범위는 고출력 집단에서 상대적으로 크게, 추진-회복 전환 구간인 P2 (150-210°)에서는 저출력 집단에서 상대적으로 크게 나타나는 경향을 보였으나, 이러한 경향은 안장 높이를 대상자가 선호하는 높이로 설정함에 따른 집단 간 미세한 차이가 영향을 미쳤을 가능성이 있다(Bini et al., 2010; Ferrer-Roca et al., 2014; Millour et al., 2020). 발분절 각속도의 경우에도 집단 간에 통계적으로 유의한 차이가 관찰되지 않았으며, P1, P2, P4 구간에서 고출력 집단의 최대 각속도가 상대적으로 크게 나타나는 경향은 통계적 유의성에 도달하지 못하였다.
본 연구의 핵심적인 발견은 발분절 각가속도에서 관찰되었다. 고출력 집단은 P1 구간(30-150°)에서의 최대 각가속도(MFSAA)가 저출력 집단에 비해 유의하게 크게 나타났으며(HPG: -1051.3±402.5 deg/s2, LPG: -462.5±223.9 deg/s2, p=.011, d=1.808), E2 시점(150°)에서의 각가속도(FSAA) 또한 유의하게 크게 나타났다(HPG: -1752.4±961.4 deg/s2, LPG: -756.0±459.2 deg/s2, p=.041, d=1.321). 두 변인 모두 Cohen (1988)의 기준에 따른 큰 효과크기(|d|≥0.8)를 나타내어, 통계적 유의성뿐만 아니라 실질적으로도 의미 있는 집단 간 차이임을 확인하였다. 발분절 각가속도는 발분절 회전 속도의 변화율로서 발분절에 작용하는 회전력의 방향과 크기를 반영한다(Karduna, 2012). P1 구간은 실효 추진력이 생성되는 주 추진 구간으로(Dorel et al., 2010), 이 구간에서 발분절이 배측굴곡에서 저측굴곡으로 전환되면서 페달에 대한 힘 전달이 이루어진다(Sanderson & Black, 2003). 고출력 집단에서 이 구간의 최대 각가속도가 크게 나타난 것은 발분절의 저측굴곡 방향으로의 가속이 보다 신속하게 이루어졌음을 의미하며, 이는 페달에 전달되는 힘의 생성률(rate of force development)과 직접적으로 관련될 수 있다(Maffiuletti et al., 2016).
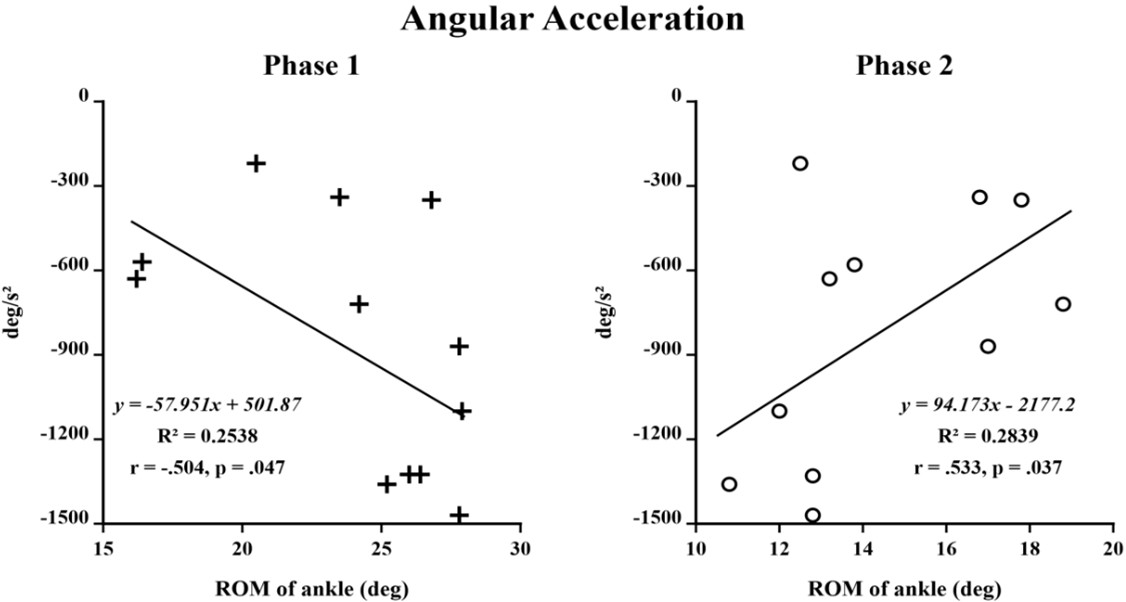
이러한 발견의 역학적 의미를 이해하기 위해 추가적으로 수행한 상관관계 분석 결과, P1 구간 가동범위와 P1 구간 최대 각가속도 간에는 부적 상관관계가(r=-.504, p=.047), P2 구간 가동범위와 P1 구간 최대 각가속도 간에는 정적 상관관계가(r=.533, p=.037) 관찰되었다(Figure 3). 본 연구에서 FSAA의 저측굴곡 방향을 음(-)의 값으로 정의하였으므로, 음의 각가속도 값이 클수록(절대값 기준) 저측굴곡 방향으로의 가속이 크게 발현됨을 의미한다. 따라서 P1 구간 가동범위와의 부적 상관관계(r=-.504)는 주 추진 구간(P1)에서 발분절의 가동범위가 클수록 저측굴곡 방향으로의 최대 각가속도가 크게 발현됨을 나타낸다(Dorel et al., 2010). 이후 추진-회복 전환 구간(P2)에서는 발분절의 가동범위를 최소화하여 생성된 힘을 페달에 직접적으로 전달하는 전략이 채택되고 있음을 시사한다(Bini & Diefenthaeler, 2009). 이는 페달링 시 발목관절의 움직임이 하지 근육에서 생성된 힘을 페달에 전달하는 핵심적 역할을 한다는 선행연구의 관점과 일맥상통한다(Bini, Hume, Croft & Kilding, 2013).
본 연구의 결과를 종합하면, 200 W 이상의 고출력 페달링과 그 미만의 저출력 페달링 간의 차이는 발분절의 위치(각도)나 움직임 속도(각속도)보다는 움직임의 가속 특성(각가속도)에서 보다 명확하게 나타남을 알 수 있다(Miletello, Beam & Cooper, 2009). 특히 주 추진 구간(P1)과 추진력 생성 종료 시점(E2)에서의 발분절 각가속도 차이는 고출력 페달링을 위해 이 구간에서의 신속한 발분절 제어가 중요함을 시사한다(Dorel et al., 2010). 이러한 발견은 사이클 동호인들이 페달링 효율성을 향상시키기 위해서는 단순히 발목관절의 가동범위를 증가시키는 것이 아니라, 추진 구간 초반부에서 발분절 각가속도를 증대시키는 훈련에 초점을 맞출 필요가 있음을 제안한다(Cannon, Kolkhorst & Cipriani, 2007). 다만, 본 연구는 여성 사이클리스트만을 대상으로 하였으며 각 집단의 표본 크기가 6명으로 제한적이었다는 점에서 탐색적 연구(pilot study)의 성격을 갖는다. 따라서 본 연구의 결과는 고출력 페달링의 운동학적 특성에 대한 예비적 증거로서 해석되어야 하며, 결과의 일반화에는 주의가 필요하다(Lakens, 2022). 향후 연구에서는 발분절 최대 각가속도가 발현되는 정확한 크랭크 각도를 세밀하게 분석하고(Bini et al., 2013), 대상자 수를 확대하여 본 연구에서 도출된 예비적 발견의 재현성과 일반화 가능성을 검증할 필요가 있다.
본 연구는 고출력(200 W 이상) 페달링 집단과 저출력(200 W 미만) 페달링 집단 간 발분절의 운동학적 특성을 페달링 역학의 기능적 이벤트 시점을 기준으로 비교한 결과, 발분절각, 가동범위, 각속도에서는 집단 간 유의한 차이가 없었으나, 주 추진 구간(P1: 30-150°)의 최대 각가속도와 추진력 생성 종료 시점(E2: 150°)의 각가속도에서 고출력 집단이 유의하게 크게 나타났다. 이는 고출력 페달링의 운동학적 특성이 발분절의 위치나 속도보다 가속 특성에서 명확하게 발현됨을 시사하며, 페달링 효율성 향상을 위해서는 추진 구간 초반부에서 발분절 각가속도를 증대시키는 훈련이 필요함을 제안한다. 다만, 본 연구는 여성 사이클리스트만을 대상으로 하였으며 각 집단의 표본 크기가 6명으로 제한적이었다는 점에서 탐색적 연구(pilot study)의 성격을 갖는다. 따라서 본 연구의 결과는 고출력 페달링의 운동학적 특성에 대한 예비적 증거로서 해석되어야 하며, 결과의 일반화에는 주의가 필요하다(Lakens, 2022). 향후 연구에서는 발분절 최대 각가속도가 발현되는 정확한 크랭크 각도를 세밀하게 분석하고(Bini et al., 2013), 대상자 수를 확대하여 본 연구에서 도출된 예비적 발견의 재현성과 일반화 가능성을 검증할 필요가 있다.
References
1. Aasvold, L. O., Ettema, G. & Skovereng, K. (2019). Joint specific power production in cycling: The effect of cadence and intensity. PLOS ONE, 14(2), e0212781.
Google Scholar
2. Atkinson, G., Peacock, O., St Clair Gibson, A. & Tucker, R. (2007). Distribution of power output during cycling: Impact and mechanisms. Sports Medicine, 37(8), 647-667.
Google Scholar
3. Bailey, M. P., Maillardet, F. J. & Messenger, N. (2003). Kinematics of cycling in relation to anterior knee pain and patellar tendinitis. Journal of Sports Sciences, 21(8), 649-657.
Google Scholar
4. Bertucci, W., Grappe, F., Girard, A., Betik, A. & Rouillon, J. D. (2005). Effects on the crank torque profile when changing pedalling cadence in level ground and uphill road cycling. Journal of Biomechanics, 38(5), 1003-1010.
Google Scholar
5. Bini, R. R. & Diefenthaeler, F. (2009). Mechanical work and co- ordinative pattern of cycling: A literature review. Kinesiology, 41(1), 25-39.
Google Scholar
6. Bini, R. R., Rossato, M., Diefenthaeler, F., Carpes, F. P., dos Reis, D. C. & Moro, A. R. P. (2010). Pedaling cadence effects on joint mechanical work during cycling. Isokinetics and Exercise Science, 18(1), 7-13.
Google Scholar
7. Bini, R. R., Tamborindeguy, A. C. & Mota, C. B. (2010). Effects of saddle height, pedaling cadence, and workload on joint kinetics and kinematics during cycling. Journal of Sport Rehabilitation, 19(3), 301-314.
Google Scholar
8. Bini, R. R., Hume, P., Croft, J. L. & Kilding, A. (2013). Pedal force effectiveness in cycling: A review of constraints and training effects. Journal of Science and Cycling, 2(1), 11-24.
Google Scholar
9. Bini, R. & Priego-Quesada, J. I. (2022). Methods to determine saddle height in cycling and implications of changes in saddle height in performance and injury risk: A systematic review. Journal of Sports Sciences, 40(4), 369-380.
Google Scholar
10. Borszcz, F. K., Tramontin, A. F. & Costa, V. P. (2020). Reliability of the functional threshold power in competitive cyclists. International Journal of Sports Medicine, 41(3), 175-181.
Google Scholar
11. Bourke, R. J. (2017). The effects of localized fatigue in the knee extensors on crank power and muscle activation [Master's thesis, Victoria University]. Victoria University VUIR Re- pository.
Google Scholar
12. Buehler, R. & Pucher, J. (2021). COVID-19 impacts on cycling, 2019-2020. Transport Reviews, 41(4), 393-400.
Google Scholar
13. Cannon, D. T., Kolkhorst, F. W. & Cipriani, D. J. (2007). Effect of pedaling technique on muscle activity and cycling efficiency. European Journal of Applied Physiology, 99(6), 659-664.
Google Scholar
14. Carpes, F. P., Dagnese, F., Mota, C. B. & Stefanyshyn, D. J. (2009). Cycling with noncircular chainring system changes the three-dimensional kinematics of the lower limbs. Sports Biomechanics, 8(4), 275-283.
Google Scholar
15. Cohen, J. (1988). Statistical power analysis for the behavioral sciences (2nd ed.). Lawrence Erlbaum Associates.
Google Scholar
16. Ditroilo, M., Mesquida, C., Abt, G. & Harper, L. D. (2025). Ex- ploratory research in sport and exercise science: Percep- tions, challenges, and recommendations. Journal of Sports Sciences, 43(12).
Google Scholar
17. Dorel, S., Couturier, A., Lacour, J. R., Vandewalle, H., Hautier, C. & Hug, F. (2010). Force-velocity relationship in cycling revisited: Benefit of two-dimensional pedal forces analysis. Medicine and Science in Sports and Exercise, 42(6), 1174-1183.
Google Scholar
18. Evans, S. A., Ballhause, K., James, D. A., Rowlands, D. & Lee, J. B. (2021). The development and validation of an inertial sensor for measuring cycling kinematics: A preliminary study. Journal of Science and Cycling, 10(3), 35-44.
Google Scholar
19. Ferrer-Roca, V., Bescós, R., Roig, A., Galilea, P., Valero, O. & García-López, J. (2014). Acute effects of small changes in bicycle saddle height on gross efficiency and lower limb kinematics. Journal of Strength and Conditioning Research, 28(3), 784-791.
Google Scholar
20. FitzGibbon, S., Vicenzino, B. & Hough, S. (2016). Intervention at the foot-shoe-pedal interface in competitive cyclists. International Journal of Sports Physical Therapy, 11(4), 637-650.
Google Scholar
21. García-López, J., Díez-Leal, S., Ogueta-Alday, A., Larrazabal, J. & Rodríguez-Marroyo, J. A. (2016). Differences in pedalling technique between road cyclists of different competitive levels. Journal of Sports Sciences, 34(17), 1619-1626.
22. Götschi, T., Garrard, J. & Giles-Corti, B. (2016). Cycling as a part of daily life: A review of health perspectives. Transport Reviews, 36(1), 45-71.
Google Scholar
23. Gregersen, C. S. & Hull, M. L. (2006). How changing the inversion/eversion foot angle affects the nondriving inters- egmental knee moments and the relative activation of the vastii muscles in cycling. Journal of Biomechanical Engineering, 128(3), 391-398.
Google Scholar
24. Hamill, J. & Knutzen, K. M. (2006). Biomechanical basis of human movement (2nd ed.). Lippincott Williams & Wilkins.
Google Scholar
25. Hamill, J., Knutzen, K. M. & Derrick, T. R. (2015). Biomechanical basis of human movement (4th ed.). Wolters Kluwer Health/Lippincott Williams & Wilkins.
Google Scholar
26. Hoekstra, R., Kiers, H. A. L. & Johnson, A. (2012). Are assump- tions of well-known statistical techniques checked, and why (not)? Frontiers in Psychology, 3, 137.
Google Scholar
27. Holliday, W., Theo, R., Fisher, J. & Swart, J. (2023). Cycling: Joint kinematics and muscle activity during differing intensities. Sports Biomechanics, 22(1), 1-15.
Google Scholar
28. Hug, F., Drouet, J. M., Champoux, Y., Couturier, A. & Dorel, S. (2008). Interindividual variability of electromyographic patterns and pedal force profiles in trained cyclists. European Journal of Applied Physiology, 104(4), 667-678.
Google Scholar
29. Karduna, A. R. (2012). Introduction to biomechanical analysis. In Biomechanical principles (pp. 3-20). University of Oregon Biomechanics Laboratory.
30. Lakens, D. (2013). Calculating and reporting effect sizes to facilitate cumulative science: A practical primer for t-tests and ANOVAs. Frontiers in Psychology, 4, 863.
Google Scholar
31. Lakens, D. (2022). Sample size justification. Collabra: Psych- ology, 8(1), Article 33267.
Google Scholar
32. Leirdal, S. & Ettema, G. (2011). The relationship between cadence, pedalling technique and gross efficiency in cycling. European Journal of Applied Physiology, 111(12), 2885-2893.
Google Scholar
33. Maffiuletti, N. A., Aagaard, P., Blazevich, A. J., Folland, J., Tillin, N. & Duchateau, J. (2016). Rate of force development: Physiological and methodological considerations. European Journal of Applied Physiology, 116(6), 1091-1116.
Google Scholar
34. Miletello, W. M., Beam, J. R. & Cooper, Z. C. (2009). A biomech- anical analysis of the squat between competitive collegiate, competitive high school, and novice powerlifters. Journal of Strength and Conditioning Research, 23(5), 1611-1617.
Google Scholar
35. Millour, G., Duc, S., Ouvrard, T., Segui, D., Puel, F. & Bertucci, W. (2020). Variability of ankle kinematics in professional cyclists: Consequence on saddle height adjustment. Journal of Science and Cycling, 9(1), 25-32.
Google Scholar
36. Momeni, K., Faghri, P. D. & Evans, M. (2014). Lower-extremity joint kinematics and muscle activations during semi-reclined cycling at different workloads in healthy indi- viduals. Journal of NeuroEngineering and Rehabilitation, 11(1), 146.
Google Scholar
37. Robertson, D. G. E. & Dowling, J. J. (2003). Design and re- sponses of Butterworth and critically damped digital filters. Journal of Electromyography and Kinesiology, 13(6), 569-573.
Google Scholar
38. Sanderson, D. J. & Black, A. (2003). The effect of prolonged cycling on pedal forces. Journal of Sports Sciences, 21(3), 191-199.
Google Scholar
39. Takaishi, T., Yamamoto, T., Ono, T., Ito, T. & Moritani, T. (1998). Neuromuscular, metabolic, and kinetic adaptations for skilled pedaling performance in cyclists. Medicine and Science in Sports and Exercise, 30(3), 442-449.
Google Scholar
40. Wakeling, J. M. & Horn, T. (2009). Neuromechanics of muscle synergies during cycling. Journal of Neurophysiology, 101(2), 843-854.
Google Scholar
41. Winter, D. A. (2009). Biomechanics and motor control of human movement (4th ed.). John Wiley & Sons.
Google Scholar
