Open Access, Peer-reviewed
eISSN 2093-9752
Open Access, Peer-reviewed
eISSN 2093-9752
Jin-Sun Kim
Hanyeop Cho
Bo-Ram Han
So-Ya Yoon
Seonhyung Park
Hyunseung Cho
Joohyeon Lee
Hae-Dong Lee
http://dx.doi.org/10.5103/KJSB.2016.26.1.21 Epub 2016 April 20
Abstract
Objective: This study aimed to examine the characteristics of joint kinematics and synchronicity of rowing motion between elite and non-elite rowers.
Methods: Two elite and two non-elite rowers performed rowing strokes (3 trials, 20 strokes in each trial) at three different stroke rates (20, 30, 40 stroke/min) on two stationary rowing ergometers. The rowing motions of the rowers were captured using a 3-dimensional motion analysis system (8-infrared camera VICON system, Oxford, UK). The range of motion (RoM) of the knee, hip, and elbow joints on the sagittal plane, the lead time (TLead) and the drive time TDrive) for each joint, and the elapsed time for the knee joint to maintain a fully extended position (TKnee) during the stroke were analyzed and compared between elite and non-elite rowers. Synchronicity of the rowing motion within and between groups was examined using coefficients of variation (CV) of the TDrive for each joint.
Results: Regardless of the stroke rate, the RoM of all joints were greater for the elite than for non-elite rowers, except for the RoMs of the knee joint at 30 stroke/min and the elbow joint at 40 stroke/min (p < .05). Although the TLead at all stroke rates were the same between the groups, the TDrive for each joint was shorter for the elite than for the non-elite rowers. During the drive phase, elite rowers kept the fully extended knee joint angle longer than the non-elite rowers (p < .05). The CV values of the TDrive within each group were smaller for the elite compared with non-elite rowers, except for the CV values of the hip at all stroke/min and elbow at 40 stroke/min.
Conclusion: The elite, compared with non-elite, rowers seem to be able to perform more powerful and efficient rowing strokes with large RoM and a short TDrive with the same TLead.
Keywords
Human Rowing Kinematics Synchronicity Rowing ergometer
A rowing stroke is a series of repeated movements starting with catch, then drive, finish, and recovery. When the catch motion of immersing the blade in the water is followed by the drive stage, continuous movements occur with ankle, knee, hip, and waist joints extended and shoul- der and elbow joints flexed. After the finish stage of taking the blade out of the water, the extended body cycles to the recovery stage to revert back to being flexed during the catch stage. In a 2,000 m rowing competition more than 200 stokes are performed. It is therefore necessary to accurately and efficiently perform the four stages with consistency (Smith & Loschner, 2002). To create optimal rowing motions with the continuous stages harmoniously connected, equipment such as the blade's handle, seat, and stretcher and the rower's body segments must interact with each other (Baudouin & Hawkins, 2002; Holt, Bull, Cashman, & McGregor, 2003). In addition to muscular power and muscular endurance, the spine and trunk play an important role in transferring the power generated by the arms and legs to the blade (Holt et al., 2003; Lamb, 1989; Roy, De Luca, Snyder-Mackler, Emley, Crenshaw, & Lyons, 1990). Although leverage of the blade and fluid mechanics system affects the power transferred to the blade, the completion of the entire movement depends on the rower's strength and his/her ability to optimize its application, and thus more accurate stroke training and feedback are necessary.
In kinematics and motion mechanics studies regarding rowing movements, conformity, timing, balance, and rhythm were suggested as the main factors improving athletic performance of rowing (Martin & Bernfield, 1979; Asami, Adachi, & Yamamoto, 1981; Schneider & Hauser, 1981; Nelson & Widule, 1982; Smith & Spinks, 1995; MacFarlane, Edmond, & Walmsley, 1997; Smith & Loschner, 2002; Barrett & Manning, 2004; Baudouin & Hawkins, 2004; Buckeridge, Bull, & McGregor, 2015).
These study results indicate that since rowing is a sport of many rowers racing on one boat, synchronicity of the motions among rowers must be studied, as well as com- parisons of stroke motions between professional and ama- teur rowers and understanding the major joint movements of elite rowers to offer better feedback to the rowers.
Therefore, this study investigated the kinematic move- ment of the upper and lower limb joints during the rowing stroke movement of professional and non-professional players with three different speeds, in order to provide more precise information for sports scientists and on-site coaches to offer feedback and training in optimal rowing motions.
1. Subjects
In this study, both professional and non-professional rowers without any medical history or musculoskeletal disease of the upper and the lower limbs were selected as experimental subjects. Two heavyweight rowers with more than 8 years of experience registered in the Korean Rowing Association participated as subjects of the profes- sional rower group, and two heavyweight healthy adults without any past rowing experience participated as non-professionals (Table 1). The experiment was conducted after the participants voluntarily signed the consent form based on their sufficient understanding of the goals and methods of the experiment.
|
Group |
N |
Age |
Weight |
Height |
|
Elite (E) |
2 |
22 |
87.4±2.5 |
192 |
|
Non-elite (NE) |
2 |
26.5±0.5 |
91.2±3 |
185.6±0.2 |
|
Total |
4 |
24.3±2.3 |
89.3±3.4 |
188.8±3.2 |
2. Equipment & methods
Prior to the experiment, the participants' height, weight, leg length, thickness of knee joint as well as ankle, shoulder, and elbow, and ankle joints were measured, and 14 mm spherical reflective markers were attached to the subject and the rowing ergometer (Model D, Concept2, US) in order to collect 3-D image data of the upper and lower limb segment. The attached markers are the Plug-In-Gait Full Body Marker Set from Vicon, and a total of 35 markers were used in the following areas: over the left and right temple, horizontal plane of the forehead, 7th cervical ver- tebra, 10th thoracic vertebra, jugular notch, xiphoid process, middle of the right scapula, the left and the right acro- mioclavicular joint, lateral epicondyle approximating the elbow joint, styloid process of the radius, styloid process of the ulna, proximal 3th metacarpal bone, anterior superior iliac spine, posterior superior iliac spine, lower lateral 1/3 surface of the thigh, lateral epicondyle of the knee, lower 1/3 of the shank, lateral malleolus, calcaneus, and 2th metatarsal head. Additionally, ten more markers were attached to show the position of the rowing ergometer to the right and the left of the front holder, the back holder, the handle, the stretcher, and the tail. With two rowing ergometers positioned in front and back, 3-D image data of the rowing motion was recorded using 8 infrared cameras (Vicon MX-f20, Oxford Metrics Ltd, Oxford, UK) and a motion analysis system (Vicon Motion Capture Systems, Oxford Metrics Ltd, Oxford, UK), and the data was simultaneously collected for the two participants with a frequency of 200 Hz. Kinematic variables of the collected data were analyzed using the Vicon Plug-In-Gait Full Body model.
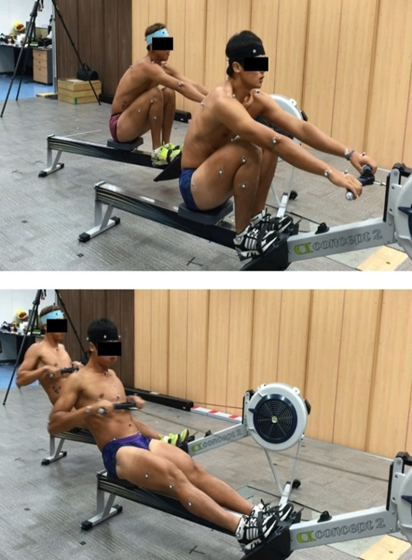
In this experiment, two participants in the same group simultaneously performed the rowing motions at three different rates of 20, 30, and 40 strokes/min, with 10 minutes of practice time prior to measurement for the sub- jects to familiarize themselves with the motions (Figure 2). A metronome was used as a signal to control the rate, and three replicates were obtained for each rate. Image collection was completed after 20 successful strokes since the motions of the two subjects were synchronized to the given rate. A minimum of 5 minutes of break time was given between the trials to minimize any effect due to exhaustion.
3. Data analysis
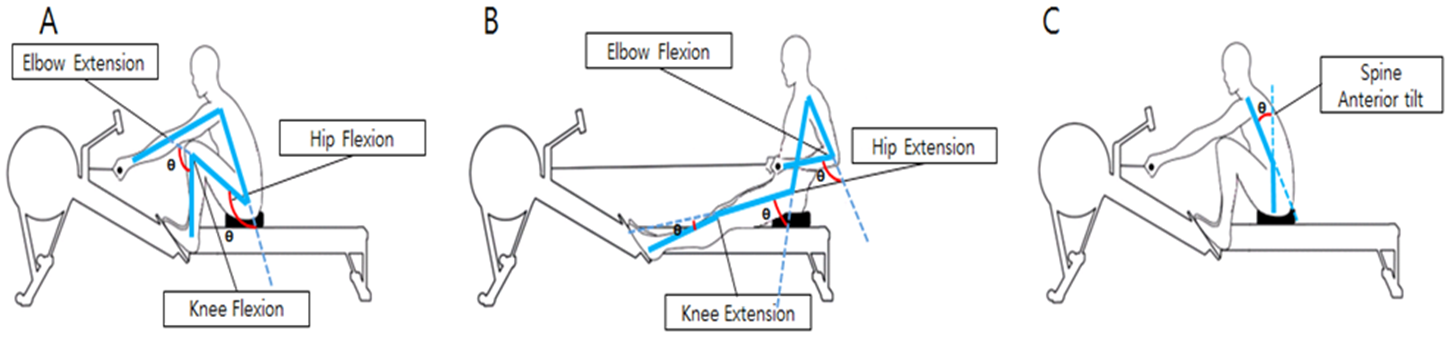
In order to analyze the collected data, one stroke was defined as from a catch moment that the blade is pos- itioned in the very front to the next catch moment (Figure 1), and five continuous strokes were selected among the recorded 20 strokes, with a total of 15 strokes per rate per subject.
Based on the collected data, kinematic variables of the spine joint, the elbow joint, the hip joint, and the knee joint were analyzed on the sagittal plane using the Vicon Plug-In-Gait Full Body model.
In cases of the hip joint, knee joint, and elbow joint, the joint angle is defined as the relative angle of the two segments of the joint. In flexion, the angle is positive, and in extension, negative. With the spinal joint, the joint angle is defined as the relative angle between the thorax and pelvis; the value is positive if the thorax leans forward relative to the pelvis, and if leaning backward, it is negative. The thorax and pelvis are the absolute angle according to the standard coordinates, with positive values when tilting forward and negative when tilting backward. The range of motion of the joints was calculated as the differ- ence between the maximum and minimum of each joint angle (Figure 1).
Stroke time (TStroke) was calculated as the time taken from a catch moment to the next catch, after tracking the marker attached to the ergometer handle. Drive time (TDrive), from a catch stage when the blade enters the water to a finished stage when the blade exits the water, was also obtained by tracking the marker on the handle, and the ratio of the drive stage during each stroke was analyzed.
The variables used to compare the pattern of the rowing motion between professional and non-professional rowers are the time for each joint to reach the drive motion (maximum flexion/extension), angular rate of joint, and duration of the maximum extension of the knee joint. To examine the sequence of the joint motions for the drive, the times required for each joint to reach maximum flexion /extension were calculated and compared. Here, due to the nature of the rowing motion, the time for the maxi- mum extension (negative) was used for the spinal joint, hip joint, and knee joint, whereas the time for the maximum flexion (positive) was used with the elbow joint. The angular speed for each joint was calculated by dividing RoM by drive time. Duration for knee joint extension was calculated by setting the extension range of ± 5° from the maximum knee extension angle. To compare the speed synchronicity for each joint during the rowing motion for each group, the drive time and the coefficient of variation (CV) of angular speed for each joint were calculated and analyzed. A and B values are the drive time and the angular joint speed of the two participants of the same group, respectively. Equa- tion (1) was used to calculate the synchronicity value between subjects to reach the value closer to 100 as the difference between subjects gets smaller. The obtained average and the standard deviation of the 15 strokes were used to calculate the coefficient of variation, as shown in Equation (2).
Synchronicity value between subjects = 100 - |A-B| (1)
Coefficient of variance (CV)(%) = Standard deviation/mean x100 (2)
The Mann-Whitney U test was used to examine the kinematic variables of the upper and the lower limb joints and the different rowing patterns shown between the professional and the non-professional rowers during the rowing motions at three different rates, with a statistical significance level of α = .05.
The results of the angles and times regarding the kine- matic variables of the spinal joint, the elbow joint, the hip joint, and the knee joint on the sagittal plane of the pro- fessional and the non-professional rowers are summarized in Table 2, 3, 4, and 5.
1. Joint angle (Minimum Angle [MIN], Maximum Angle [MAX], Range of Motion [RoM])
At the rate of 20 and 30 strokes/min, the minimum angle of the hip joint, the knee joint, the spinal joint, pelvis, and thorax showed significant differences between the profes- sionals and the non-professionals (p < .05), but no differ- ence was seen in the elbow joint angle. At the highest rate of 40 strokes/min, a significance difference was seen in the hip joint, the elbow joint, thorax, and pelvis, but not in the knee joint or the spinal joint.
At the rate of 20 stroke/min, the maximum angles of the knee joint, the elbow joint, the spinal joint, and thorax showed significant differences (p < .05) between the pro- fessionals and the non-professionals, but not in the hip joint or the pelvis. At the rate of 30 stroke/min, the elbow joint, the thorax, and the spinal joint showed significant differences in maximum angle, but not the hip joint, the knee joint, or the pelvis. At the rate of 40 stroke/min, a significant difference was observed in the hip joint, the knee joint, and the elbow joint (p < .05), but not in the thorax, the pelvis, and the spinal joint.
|
Rate (stroke/ |
Group |
Joint
angle |
|||||||
|
HIP |
KNEE |
ELBOW |
THORAX |
SPINE |
PELVIS |
||||
|
MIN (unit: |
20 |
Elite |
Mean ± SD |
25.93±3.06 |
0.03±3.43 |
40.21±6.10 |
-26.34±1.69 |
23.71±5.62 |
-49.65±3.08 |
|
Non-Elite |
39.13±6.65 |
-1.66±3.30 |
41.95±5.39 |
-15.73±4.87 |
19.88±7.33 |
-37.12±8.02 |
|||
|
Mann-Whitney
U |
39.00 |
309.00 |
354.00 |
35.00 |
272.00 |
77.00 |
|||
|
p |
< .0001* |
.037* |
.156 |
< .0001 |
.008* |
< .0001* |
|||
|
30 |
Elite |
Mean ± SD |
27.10±3.42 |
2.65±3.66 |
39.75±6.18 |
-23.81±2.62 |
25.80±1.70 |
-49.03±3.73 |
|
|
Non-Elite |
46.40±5.61 |
0.15±3.08 |
40.45±5.72 |
-12.75±4.50 |
17.23±9.04 |
-30.60±6.74 |
|||
|
Mann-Whitney
U |
.00 |
297.00 |
363.00 |
15.00 |
212.00 |
.00 |
|||
|
p |
< .0001* |
.024* |
.198 |
< .0001* |
< .0001* |
< .0001* |
|||
|
40 |
Elite |
Mean ± SD |
27.14±4.70 |
3.47±4.32 |
39.65±5.82 |
-23.00±1.89 |
27.07±2.15 |
-49.24±4.27 |
|
|
Non-Elite |
45.57±6.67 |
3.69±2.84 |
38.46±6.22 |
-10.56±2.74 |
22.19±7.40 |
-33.15±8.17 |
|||
|
Mann-Whitney
U |
.00 |
412.00 |
317.00 |
.00 |
371.00 |
9.00 |
|||
|
p |
< .0001* |
.574 |
.049* |
< .0001* |
.243 |
< .0001* |
|||
|
MAX (unit: |
20 |
Elite |
Mean ± SD |
104.12±2.99 |
138.90±2.03 |
148.52±3.22 |
33.43±1.88 |
56.88±6.30 |
-15.93±2.15 |
|
Non-Elite |
104.37±5.53 |
131.54±4.37 |
138.56±4.67 |
24.22±4.52 |
47.66±8.11 |
-18.00±4.76 |
|||
|
Mann-Whitney
U |
371.00 |
65.00 |
10.00 |
8.00 |
181.00 |
352.00 |
|||
|
p |
.243 |
< .0001* |
< .0001* |
< .0001* |
< .0001* |
.147 |
|||
|
30 |
Elite |
Mean ± SD |
104.43±4.09 |
133.99±2.60 |
149.47±1.19 |
33.06±0.80 |
54.21±2.32 |
-17.46±3.31 |
|
|
Non-Elite |
106.60±1.53 |
133.91±3.80 |
138.87±9.07 |
24.31±12.90 |
43.54±13.65 |
-16.56±3.65 |
|||
|
Mann-Whitney
U |
374.00 |
440.00 |
64.00 |
279.00 |
269.00 |
388.00 |
|||
|
p |
.261 |
.882 |
< .0001* |
.011* |
.007* |
.359 |
|||
|
40 |
Elite |
Mean ± SD |
103.57±3.18 |
126.19±5.35 |
149.43±2.35 |
33.76±0.77 |
55.88±1.70 |
-18.86±1.08 |
|
|
Non-Elite |
100.55±3.04 |
119.90±4.82 |
143.19±4.05 |
29.68±6.74 |
51.02±9.77 |
-19.26±5.14 |
|||
|
Mann-Whitney
U |
233.00 |
176.00 |
64.00 |
336.00 |
419.00 |
448.00 |
|||
|
p |
.001* |
< .0001* |
< .0001* |
.092 |
.647 |
.976 |
|||
|
RoM (unit: |
20 |
Elite |
Mean ± SD |
78.19±3.24 |
138.87±2.81 |
108.30±3.28 |
59.78±3.25 |
33.16±8.35 |
33.71±2.33 |
|
Non-Elite |
65.23±8.00 |
133.20±2.95 |
96.60±8.12 |
39.95±8.22 |
27.78±6.33 |
19.11±4.04 |
|||
|
Mann-Whitney
U |
50.00 |
80.00 |
83.00 |
4.00 |
276.00 |
.000 |
|||
|
p |
< .0001* |
< .0001* |
< .0001* |
< .0001* |
.010* |
< .0001* |
|||
|
30 |
Elite |
Mean ± SD |
77.32±1.25 |
131.34±1.74 |
109.72±5.22 |
56.87±2.01 |
28.40±2.70 |
31.56±1.27 |
|
|
Non-Elite |
60.20±5.61 |
133.76±5.28 |
98.41±13.88 |
37.07±12.46 |
26.30±7.10 |
14.03±4.90 |
|||
|
|
Mann-Whitney U |
.000 |
350.00 |
255.00 |
110.00 |
390.00 |
.000 |
||
|
|
< .0001* |
.139 |
.004* |
< .0001* |
.375 |
< .0001* |
|||
|
RoM (unit: |
40 |
Elite |
Mean ± SD |
76.43±1.86 |
122.71±2.74 |
109.78±4.73 |
56.76±2.27 |
28.81±3.47 |
30.34±3.66 |
|
Non-Elite |
54.97±4.68 |
116.21±6.01 |
104.72±9.72 |
40.24±8.46 |
28.83±3.37 |
13.88±3.88 |
|||
|
Mann-Whitney
U |
.000 |
146.00 |
343.00 |
12.00 |
450.00 |
.000 |
|||
|
p |
< .0001* |
< .0001* |
.114 |
< .0001* |
1.00 |
< .0001* |
|||
2. Stroke time and drive time
When given three standard rates of 20 stroke/min (40 bpm), 40 stroke/min (60 bpm), and 60 stroke/min (80 bpm) using a metronome, the results in time for one stroke and one drive between the professional and non-professional groups are described in Table 3. At 20 stroke/min, the pro- fessional's stroke time was 3.07 ± 0.01 seconds with a drive time of 0.99 ± 0.03 seconds, and the non-professional's stroke time was 2.99 ± 0.09 seconds with a drive time of 1.35 ± 0.09 seconds. At 30 stroke/min, professionals showed 1.93 ± 0.04 seconds and 0.88 ± 0.03 seconds of stroke and drive time, respectively, and non-professionals 2.00 ± 0.03 seconds and 0.98 ± 0.02 seconds. At 40 stroke/min, professionals showed 1.50 ± 0.06 seconds and 0.73 ± 0.02 seconds, and non-professionals 1.48 ± 0.03 seconds and 0.75 ± 0.02 seconds, respectively. The CV values for drive time were 0.02 for professionals and 0.08 for non-professionals at 20 stroke/min, 0.01 and 0.02 at 30 stroke/ min, and lastly, 0.009 and 0.01 at 40 stroke/min, respec- tively, which was lower for professionals at all rates.
|
Group |
20 |
30 |
40 |
|
|
Elite |
Tstroke |
3.07±0.01 |
1.93±0.04 |
1.50±0.06 |
|
TDrive |
0.99±0.03 |
0.88±0.03 |
0.73±0.02 |
|
|
TDrive CV |
0.02 |
0.01 |
0.009 |
|
|
Non-Elite |
Tstroke |
2.99±0.09 |
2.00±0.03 |
1.48±0.03 |
|
TDrive |
1.35±0.09 |
0.98±0.02 |
0.75±0.02 |
|
|
TDrive CV |
0.08 |
0.02 |
0.01 |
3. Speed of motion
Using RoM and drive time of professionals and non-professionals, the angular speed for each joint during drive was calculated and compared between the groups. Professionals displayed faster angular speed than non-professionals at all rates except for 40 stroke/min, as illus- trated in Table 4.
|
Rate |
Group |
HIP |
KNEE |
ELBOW |
THORAX |
SPINE |
PELVIS |
|
|
20 |
Elite |
Sequence |
5 |
1 |
6 |
3 |
2 |
4 |
|
Time
(sec) |
0.97±0.10 |
0.72±0.03 |
1.00±0.04 |
0.91±0.03 |
0.90±0.04 |
0.94±0.07 |
||
|
Velocity
(deg/sec) |
81.25±7.75 |
192.44±9.08 |
108.62±6.82 |
65.54±4.04 |
36.74±8.64 |
36.14±3.31 |
||
|
CV (%) |
5.27 |
11.34 |
3.22 |
2.99 |
9.85 |
2.56 |
||
|
Non- |
Sequence |
4 |
1 |
6 |
3 |
2 |
5 |
|
|
Time
(sec) |
1.32±0.11 |
1.07±0.10 |
1.35±0.10 |
1.24±0.13 |
1.17±0.18 |
1.33±0.11 |
||
|
Velocity
(deg/sec) |
49.73±6.91 |
125.39±10.53 |
71.42±4.08 |
32.30±6.07 |
24.02±5.92 |
14.38±3.05 |
||
|
CV (%) |
5.90 |
9.94 |
2.34 |
6.96 |
6.51 |
3.02 |
||
|
30 |
Elite |
Sequence |
3 |
1 |
6 |
3 |
2 |
5 |
|
Time
(sec) |
0.80±0.03 |
0.64±0.03 |
0.89±0.04 |
0.80±0.03 |
0.79±0.05 |
0.82±0.02 |
||
|
Velocity
(deg/sec) |
97.28±3.41 |
205.82±13.10 |
124.17±11.66 |
71.17±5.01 |
36.14±4.39 |
38.57±1.79 |
||
|
CV (%) |
5.25 |
8.74 |
2.20 |
2.66 |
3.86 |
2.02 |
||
|
Non- |
Sequence |
3 |
1 |
6 |
4 |
2 |
5 |
|
|
Time
(sec) |
0.84±0.06 |
0.75±0.05 |
0.98±0.03 |
0.86±0.06 |
0.83±0.06 |
0.92±0.10 |
||
|
Velocity
(deg/sec) |
71.31±5.29 |
180.32±14.00 |
100.03±13.63 |
43.22±14.54 |
31.16±7.67 |
15.55±5.75 |
||
|
CV (%) |
4.10 |
15.71 |
9.63 |
16.85 |
8.23 |
5.31 |
||
|
40 |
Elite |
Sequence |
2 |
1 |
6 |
4 |
4 |
3 |
|
Time
(sec) |
0.64±0.03 |
0.53±0.03 |
0.75±0.03 |
0.66±0.03 |
0.66±0.03 |
0.65±0.02 |
||
|
Velocity
(deg/sec) |
120.62±7.23 |
228.31±10.79 |
147.75±11.52 |
86.45±6.43 |
43.55±4.25 |
46.93±6.31 |
||
|
CV (%) |
5.37 |
4.43 |
3.97 |
3.62 |
3.76 |
3.63 |
||
|
Non- |
Sequence |
3 |
1 |
6 |
2 |
4 |
5 |
|
|
Time
(sec) |
0.65±0.03 |
0.57±0.03 |
0.77±0.02 |
0.64±0.03 |
0.66±0.03 |
0.66±0.09 |
||
|
Velocity
(deg/sec) |
84.46±6.32 |
203.89±15.49 |
136.51±15.07 |
62.75±14.02 |
43.75±4.98 |
21.53±7.21 |
||
|
CV (%) |
6.19 |
17.96 |
9.50 |
10.59 |
4.12 |
6.45 |
4. Sequence of motion
To examine the sequence of motion for each joint, Table 4 displays the time required for the spinal joint, the hip joint, or the knee joint to reach the maximum extension (negative value) as well as for the elbow joint to reach its maximum flexion (positive). At 20 stroke/min, the motion sequence for professionals is: Knee → Spine → Thorax → Pelvis → Hip → Elbow. For non-professionals: Knee → Spine → Thorax → Hip → Thorax → Elbow. At 30 stroke/min, the motion sequence for professionals is: Knee → Spine → Thorax → Hip → Pelvis → Elbow. For non-professionals: Knee → Spine → Hip → Thorax → Pelvis → Elbow. At 40 stroke/min, the motion sequence for professionals is: Knee → Hip → Pelvis → Spine → Thorax → Elbow. For non-professionals: Knee → Thorax → Hip → Spine → Pelvis → Elbow.
|
Group |
20
rate |
30
rate |
40
rate |
|
|
Elite |
1.06±0.11 |
0.43±0.03 |
0.26±0.05 |
|
|
Non-Elite |
0.44±0.08 |
0.2±0.07 |
0.17±0.04 |
|
|
Mann-Whitney U |
.000 |
2.50 |
89.50 |
|
|
p |
.000 |
.000 |
.000 |
5. Synchronicity of motion
Table 4 describes the CV for the angulate speed for each joint to examine the synchronicity between the two subjects the in professional and non-professional groups.
6. Duration of knee extension
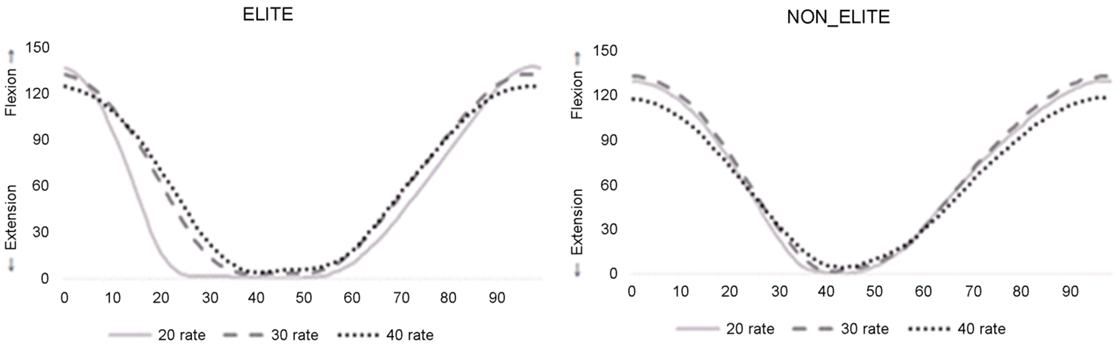
It was observed that the professionals maintained the knee at its maximum extension for a longer amount of time during the stroke than the non-professionals. At 20 stroke/min, professionals displayed 1.06 ± 0.11 seconds and non-professionals 0.44 ± 0.08 seconds, at 30 stroke/min, professionals 0.43 ± 0.03 seconds and non-professionals 0.2 ± 0.07 seconds, and at 40 stroke/min, professionals 0.26 ± 0.05 seconds and non-professionals 0.17 ± 0.04 seconds, which were all significantly different at all rates (Table 5, Figure 3).
This study examines the kinematic movement of the upper and the lower limb joints during rowing move- ment of professional and non-professional rowers at three different rates. Between the professionals and the non-professionals there was a significant difference in the maxi- mum flexion/extension, and the range of motion (RoM) for each joint was significantly higher for professionals in all joints at the rate of 20 stroke/min; in the hip joint, the elbow joint, the thorax, and the pelvis at the rate of 40 stroke/min; and in the hip joint, the knee joint, the thorax, and the pelvis at the rate of 60 stroke/min. The stroke time of the two groups was similar, but the drive time for pro- fessionals was 35.61% higher and relatively consistent, but for non-professionals the range of change was rather wide with an 80% increase in drive time (TDrive). The sequence of each joint reaching the maximum flexion/extension was also different between the groups, but no consistency was found as the rate changed. However, the duration of maximum extension of the knee joint was significantly higher in professionals.
Time for performing one stroke (Tstroke) was similar between the groups with a difference of less than 0.1 s. Also, the drive time was short in professionals, and as the rate increased, professionals showed less decrease in the drive time than non-professionals, indicating that profes- sionals create a short stroke time with a rapid recovery stage and maintain the ratio of the drive stage. Despite the shorter drive time for professionals, the maximum flexion/ extension angle for each joint and the joint RoM was also significantly larger for professionals (Table 2), with a faster moving speed per unit time than non-professionals (Table 4). In particular, as shown in Table 2, professionals showed a range of motion for the hip joint that is larger than a significantly small minimum angle. It is hard to directly measure the amount of power transferred to the lower limb joint during the rowing movement, but in the case of squat motion and vertical jump motion that have a similar range of motion of the lower limb joint, more power can be applied as the angle of the lower limb joint be- comes larger (Lee, Han, Kim, Oh, Cho, & Yoon, 2015) and because a larger movement occurs in the hip joint than in the ankle or knee joint, (Flanagan, Salem, Wang, Sanker, & Greendale, 2003; Chiu & Salem, 2006; Kim & Kim, 2009, Kim & Eun, 2009) the large range of motion of the hip joint during the stroke and the large flexion of the hip joint at the catch moment means that the total amount of power transferred to the feet is larger (Buckeridge et al., 2015). Therefore, with these movements of the joint, professionals can apply more power and accelerate the boat.
With the assumption that the professionals will display a sequential joint movement to perform the optimal motion for rowing, the time to maximize the range of motion for each joint was calculated and arranged, but there was no specific pattern for any of the groups (Table 4). However, when the drive time and synchronicity of the joint angular speed of the two subjects in each group was confirmed by obtaining its CV, drive time was quite consistent in both groups, but the angular speed was more synchronized for professionals in all joints except for the hip joint and the knee joint. Professionals were more synchronized than the non-professionals in relative comparisons, too. Moreover, during the drive stage when the knee gets flexed and the upper body leans back, the duration of maximum extension of the knee joint was twice as high for the professionals (Table 5, Figure 3). These movements transfer all of the power of pressing the paddle with the legs to the blade, minimize the loss of power, and therefore apply more power.
Based on the characteristics of the professionals' per- formance of rowing motions, similar experiments can be performed with additional professional rowers to under- stand optimal joint movement pattern. Harmonious move- ments of joints are an importance factor in rowing motions and therefore future studies need to be performed.
This study compared the kinematic characteristics of the upper and the lower limb joints during the rowing move- ments of professional rowers to that of non-professionals. The maximum flexion/extension angle and the range of motion (RoM) of each joint between professionals and non-professionals showed significant differences. Stroke time was similar in both groups. However, professionals showed a short drive time and faster angular speed in all joints during the drive when compared to the non-professionals. The sequence for each joint to reach the maximum flexion/extension was also different between the groups, but no consistency was revealed as the rate changed. However, the professionals show a relatively higher synchronicity of the moving speed of each joint, and the duration of maximum extension of the knee joint was significantly higher.
The results of this study will allow sports scientists and field coaches to provide feedback on optimum rowing motions for non-professional rowers, and provide accurate information for training. They are also expected to be utilized as basic data in implementing smart clothing and wearable systems that can be applied in practical trainings.
References
1. Asami, T., Adachi, N. & Yamamoto, K. (1981). Biomechanical analysis of rowing performances. Biomechanics VII-B, 442-446.
Crossref
2. Barrett, R. & Manning, J. (2004). Rowing: Relationships between rigging set‐up, Anthropometry, physical cap- acity, Rowing kinematics and Rowing performance. Sports Biomechanics, 3(2), 221-235.
Crossref
Google Scholar
3. Baudouin, A. & Hawkins, D. (2002). A biomechanical review of factors affecting rowing performance. British Journal of Sports Medicine, 36(6), 396-402.
Crossref
Google Scholar
4. Buckeridge, E., Bull, A. & McGregor, A. (2015). Biomech- anical determinants of elite rowing technique and per- formance. Scandinavian Journal of Medicine & Science in Sports, 25(2), e176-e183.
Crossref
Google Scholar
5. Chiu, L. Z. & Salem, G. J. (2006). Comparison of joint kinetics during free weight and flywheel resistance exercise. The Journal of Strength & Conditioning Re- search, 20(3), 555-562.
Crossref
Google Scholar
6. Flanagan, S., Salem, G. J., Wang, M.-Y., Sanker, S. E. & Greendale, G. A. (2003). Squatting exercises in older adults: kinematic and kinetic comparisons. Medicine and science in sports and exercise, 35(4), 635.
Crossref
Google Scholar
7. Holt, P., Bull, A., Cashman, P. & McGregor, A. (2003). Kine- matics of spinal motion during prolonged rowing. International journal of sports medicine, 24(8), 597-602.
Crossref
Google Scholar
PubMed
8. Kim, Y. U. & Kim, Y. J. (2009). Biomechanical Comparison of Good and Bad Performances within Individual in Maximum Vertical Jump. Korean Journal of Sports Biomechanics, 19(3), 489-497.
Crossref
Google Scholar
9. Kim, Y. U. & Eun, S. D. (2009). The Effects of Restricted Trunk Motion on the Performance of Maximum Vertical Jump. Korean Journal of Sports Biomechanics, 19(1), 27-36.
Crossref
Google Scholar
10. Lamb, D. H. (1989). A kinematic comparison of ergometer and on-water rowing. The American journal of sports medicine, 17(3), 367-373.
Crossref
Google Scholar
PubMed
11. Lee, H. D., Han, B. R., Kim, J. S., Oh, J. H., Cho, H. Y. & Yoon, S. Y. (2015). Differences in the length change pattern of the medial gastrocnemius muscle-tendon complex and fascicle during gait and one-legged and two-legged vertical jumping. Korean Journal of Sports Bio- mechanics, 25(2), 175-182.
12. MacFarlane, D., Edmond, I. & Walmsley, A. (1997). Instru- mentation of an ergometer to monitor the reliability of rowing performance. Journal of Sports Sciences, 15(2), 167-173.
Crossref
Google Scholar
PubMed
13. Martin, T. P. & Bernfield, J. S. (1979). Effect of stroke rate on velocity of a rowing shell. Medicine and science in sports and exercise, 12(4), 250-256.
Crossref
Google Scholar
PubMed
14. Nelson, W. N. & Widule, C. J. (1982). Kinematic analysis and efficiency estimate of intercollegiate female rowers. Medicine and science in sports and exercise, 15(6), 535 -541.
Crossref
Google Scholar
PubMed
15. Roy, S. H., De Luca, C. J., Snyder-Mackler, L., Emley, M. S., Crenshaw, R. L. & Lyons, J. P. (1990). Fatigue, recovery, and low back pain in varsity rowers. Medicine and science in sports and exercise, 22(4), 463-469.
Crossref
Google Scholar
PubMed
16. Schneider, E. & Hauser, M. (1981). Biomechanical analysis of performance in rowing. Biomechanics VII-B, 430-435.
Crossref
17. Smith, R. M. & Loschner, C. (2002). Biomechanics feed- back for rowing. Journal of Sports Sciences, 20(10), 783 -791.
Crossref
Google Scholar
PubMed
18. Smith, R. M. & Spinks, W. L. (1995). Discriminant analysis of biomechanical differences between novice, good and elite rowers. Journal of Sports Sciences, 13(5), 377 -385.
Crossref
Google Scholar
PubMed
