Open Access, Peer-reviewed
eISSN 2093-9752
Open Access, Peer-reviewed
eISSN 2093-9752
Seung Hyun Hyun
Che Cheong Ryew
http://dx.doi.org/10.5103/KJSB.2016.26.3.249 Epub 2016 October 15
Abstract
Objective: This purpose of this study was to analyze the relationship between dimensionless leg stiffness and kinetic variables during gait performance, and its modulation with body weight.
Method: The study sample consisted of 10 young women divided into 2 groups (Control, n=5 and Obese, n=5). Four camcorders (HDR-HC7/HDV 1080i, Sony Corp, Japan) and one force plate (AMTI., USA) were used to analyze the vertical ground reaction force (GRF) variables, center of pressure (COP), low limb joint angle, position of pelvis center and leg lengths during the stance phase of the gait cycle.
Results: Our results revealed that the center of mass (COM) displacement velocity along the y-axis was significantly higher in the obese group than that in control subjects. Displacement in the position of the center of the pelvis center (Z-axis) was also significantly higher in the obese group than that in control subjects. In addition, the peak vertical force (PVF) and dimensionless leg stiffness were also significantly higher in the obese group. However, when normalized to the body weight, the PVF did not show a significant betweengroup difference. When normalized to the leg length, the PVF and stiffness were both lower in the obese group than in control subjects.
Conclusion: In the context of performance, we concluded that increased dimensionless leg stiffness during the gait cycle is associated with increased velocity of COM, PVF, and the change in leg lengths (%).
Keywords
Dimensionless leg stiffness Body weight Gait Peak vertical force Obese
Obesity is a strong risk factor for developing degenerative knee dis- eases including osteoarthritis, and is recognized worldwide as a chronic disability (Haslam & James, 2005). From the kinematic perspective, the gait of obese individuals is characterized by short strides, wide width between feet in the standing position and time delay (Spyropoulos, Pisciotta, Pavlou, Cairns, & Simon, 1991; McGraw, McClenaghan, Williams, Dickerson, & Ward, 2000; Lai, Leung, Li, & Zhang, 2008; Browning & Kram, 2007). In addition, the range of motion of the hip and knee joints is reduced (Messier, 1994). Inappropriate gait and increased body weight cause an increase in the weight bearing of the joints in the lower limbs (Andriacchi & Mündermann, 2006), thereby causing injuries and arthritis (Hochberg et al., 1995; Stürmer, Günther, & Brenner, 2000).
Several studies have attempted to define the dynamic characteristics of the lower limb. The body is composed of very complex elements such as bones, cartilages and muscles. Therefore, extensive stiffness evaluations are conducted in biodynamics in order to understand the complexity in the dynamics of the lower limb (Butler, Crowell, & Davis, 2003).
Stiffness can be defined as the relationship between the application of external force on the body and the changes it effects (Butler et al., 2003). The dynamics of lower limb movements are usually described with spring-mass models (Arampatzis, Brüggemann, & Metzler, 1999; Blum, Lipfert, & Seyfarth, 2009; Donelan & Kram, 2000; Farley & Gonzalez, 1996; Lipfert, Günther, Renjewski, Grimmer, & Seyfarth, 2012; McMahon & Cheng, 1990). In the spring-mass model, the lower limbs are con- sidered to be linear springs without mass and the peak vertical force (PVF) is closely related to the change in length of the lower (ΔL) during the support stage (Donelan & Kram, 2000; Farley & Gonzalez, 1996; McMahon & Cheng, 1990).
Stiffness is evaluated by two different methods based on changes in the lengths of the lower limb. Vertical stiffness is the most suitable for evaluating hopping and jumping, where changes in the length of the lower limb are large, while leg stiffness is the most suitable for evaluating the dynamic characteristics of the lower limb while walking or running (McMahon & Cheng, 1990; Cavagna, Franzetti, Heglund, & Willems, 1988; McMahon, Valiant, & Frederick, 1987). Leg stiffness is usually calculated by the formula proposed by McMahon & Cheng (1990), in which the PVF is divided by ΔL. The ΔL in this formula refers to the distance be- tween the center of the hip joint and the surface on contact with the lower limb in a standing position, the vector angle between the vertical axis and the line between the center of mass and the surface, the maximum value of COM, the vertical speed of COM and the time of contact with the floor surface. Weight standardization is not taken into account.
Weight standardization can be explained from two different per- spectives. Although COM vertical speed, hop, support angle and the maximum COM vertical change were independent variables in the first leg stiffness evaluation in various types of animals (dog, goat, horse and kangaroo), they were only explained as a direct correlation between the mass and the leg stiffness (Farley, Glasheen, & McMahon, 1993). In com- parison, human movement is very complex and diverse. Assuming that the changes in leg lengths are constant, PVF, weight bearing and leg stiffness are thought to increase with mass.
When the support time is delayed and the flexion angles of the joints of the lower limb increase during gait performance, the PVF decreases as a response (Silder, Delp, & Besier, 2013; Teunissen, Grabowski, & Kram, 2007). For example, a study on walking and running reported that PVF increases with increases in weight bearing and velocity (Sildedr et al., 2013; Teunissen et al., 2007). When 30% of body weight is applied during ambulation, the average PVF increases by 15% (Silder et al., 2013). However, when 30% of the body weight is applied during running, the average PVF only increases by 12% (Teunissen et al., 2007).
When a large weight is gradually applied during gait performance, the pelvic joint flexion angle (Silder et al., 2013), knee joint flexion angle (Birrell & Haslam, 2009; Silder et al., 2013) and the dorsiflexion angle of the ankle joint (Sildedr et al., 2013) are observed to increase. The concept of weight standardization (Silder, Besier, & Delp, 2015) suggests that when different loads are applied, the angles of the joints of the lower limb are altered and leg stiffness cannot be accurately determined.
Quantification of leg stiffness after controlling for movement-related variables was proposed as a method to overcome the above limitations (Hogan & Sternad, 2009; Lee, Ranganathan, & Newell, 2011). Since there are too many variables related to human exercise and movement, it is difficult to quantify the variables into a single value and analyze them. Slider et al. (2015) used a unit-less calculation method, in which the length between the center of pressure and center of pelvis is converted into a percentage and the PVF is standardized after being divided by N. This method was used to calculate what is referred to as dimensionless leg stiffness.
Although leg stiffness increases with an increase in PVF during gait, gait is produced by the repetitive interaction between the two legs (Hyun & Ryew, 2014) and the relationship between leg stiffness and the dynamic variables of the lower limb that are modulated by weight should be carefully analyzed. Therefore, the purpose of this study is to analyze how kinetic variable change according to the differences in body weight during gait performance. More specifically, we sought to analyze the relationship between dimensionless leg stiffness and kinetic variables, in order to provide quantifiable data related to effective gait.
1. Subjects
In order to compare the leg stiffness measures between control and obese individuals, we enrolled 10 females into our study. The control group consisted of 5 participants with normal body weight (age: 25.40 ±2.30 years, height: 164.80±1.88 cm, weight: 53.95±4.00 kg, BMI: 19.86 ±1.32 kg/m2), while the obese group consisted of 5 participants with higher body weight than normal (age: 22.80±1.48 years, height: 167.24 ±1.34 cm, weight: 83.95±11.98 kg, BMI: 30.30±4.15 kg/m2). The subjects all had a rear-foot strike and had no vertebral injuries, knee injuries or foot diseases. The purpose and the procedure of the experiment were explained in detail to the participants prior to obtaining their informed consents.
2. Procedure
In order to evaluate dimensionless leg stiffness, the changes in leg lengths during gait performance were analyzed using 3D image analysis. Four video cameras (HDR/HDV 1080i, Sony Corp, Japan) were used and a control object (2 m × 2 m × 1 m) along with the gait were used to calculate the coordinates. The recording speed was set to 60 fps and the exposure was set to 1/500 sec.
In order to induce natural gait, each participant went through a 5-minute long practice session prior to the experiment. Using the right foot as a reference, the ground reaction force produced after initial contact was measured using a ground reaction force measurer (AMTI¬OR-7., USA) with a sampling rate of 600 Hz.
The use of shoes was avoided as it could potentially interfere with the analysis of the changes in leg lengths.
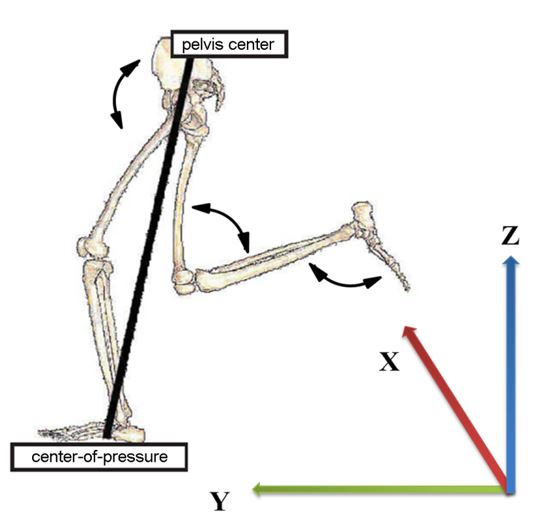
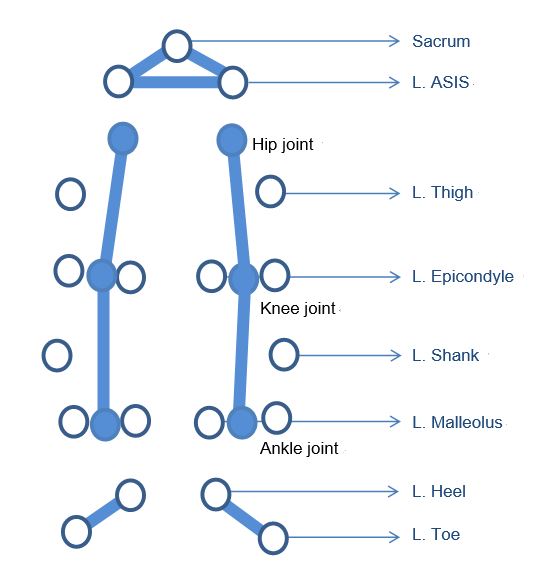
Studies by Slider et al. (2015) and Delp et al. (1990) evaluated dimen- sionless leg stiffness with the methods shown in (Figure 1 and Figure 2). In this study, 19 markers were placed on each participant to determine the rate of changes in leg lengths (right and left toe, right and left heel, right and left lateral and medial malleolus, right and left shank, right and left lateral and medial epicondyle, right and left thigh, right and left anterior superior iliac spine, and the sacrum). The pelvic joint angle was defined as the angle between the pelvis and the segmental shaft of the femur, the knee joint was defined as the angle between the femur and the lower leg bone, and the ankle joint was defined as the angle between the lower leg bone and the tarsal bones. In the 3D coordinate system, forward progress was shown along the Y axis, the left and right progress was shown along the X axis, and the vertical movement was shown along the Z axis.
3. Analysis and processing of data
The analysis was conducted during the interval between the initial contact of the right foot with the surface and the moment when the toes of the right foot detach from the ground. The dimensionless leg stiffness calculation method (Kleg) is shown below (Formula 1):
Formula 1. Dimensionless leg stiffness
where, PVF is defined as the standardized value of each participant's weight during the interval of analysis, lo is defined as the standardized value of the rate of change of leg length during the stance period of the gait, lmin is the minimum leg length during the stance phase of the gait; the leg length was measured from the COP (Bullimore & Burn, 2006) to the center of the pelvis (Plagenhoef, Evans, & Abdelnour, 1983). The Kwon GRF 2.0 program (Visol., Korea) was used to process the ground reaction force data and the Kwon 3D XP v4.0 (2007) was used to process the rate of change of leg length and to obtain kinetic variables. The kinetic variables were calculated using a control point, body-joint coordinate transformation and tuning, while the 3D coordinates were calculated using the direct linear transformation method proposed by Abdel-Aziz & Krara (1971). The cut-off frequencies obtained using the Butterworth low-pass filtering method were smoothed at 6 Hz to remove the noise before using them as data. The reconstruction error of the 36-point 3D coordinate was confirmed to be .0456 cm. The average and the standard deviation of the calculated variables were obtained using PASW 22.0 program (IBM Inc., USA) and an independent t-test was to draw comparisons between the two groups (α=.05).
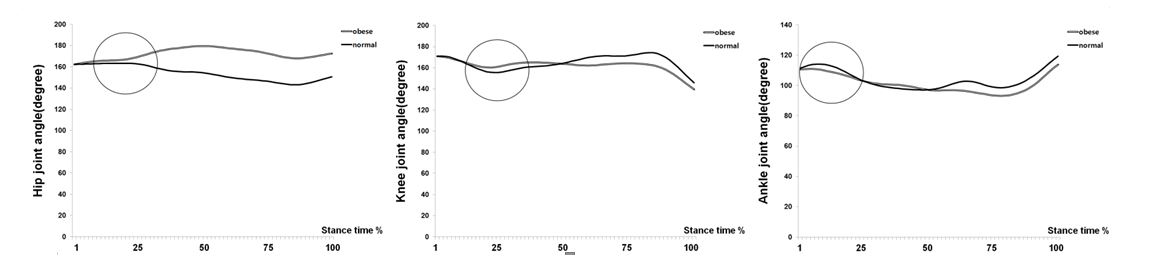
Changes in kinetic variables in the two groups are shown in (Table 1) and (Figure 3 and Figure 4). The average angle of the lower limb joints during the support period was analyzed. Change in the pelvic joint angle showed that the obese group had a significantly greater extension than the control group (p<.001). The knee joint was significantly more flexed in the obese group than in the control group (p<.001). Differences in the ankle joint angle showed that the control group had significantly greater plantar flexion compared to the obese group (p<.001).
|
Section |
Body weight group |
t |
p |
|
|
Normal |
Obese |
|||
|
Hip
joint |
153.93 ±7.10 |
172.01 ±5.09 |
14.499 |
.001*** |
|
Knee
joint |
164.80 ±6.76 |
162.00 ±5.79 |
3.763 |
.001*** |
|
Ankle
joint |
103.94 ±6.27 |
101.11 ±5.93 |
7.476 |
.001*** |
|
Velocity
of the pelvis |
137.50 ±12.40 |
121.74 ±10.74 |
17.775 |
.001*** |
|
Position
of the |
94.38 ±1.27 |
95.88 ±1.18 |
9.837 |
.001*** |
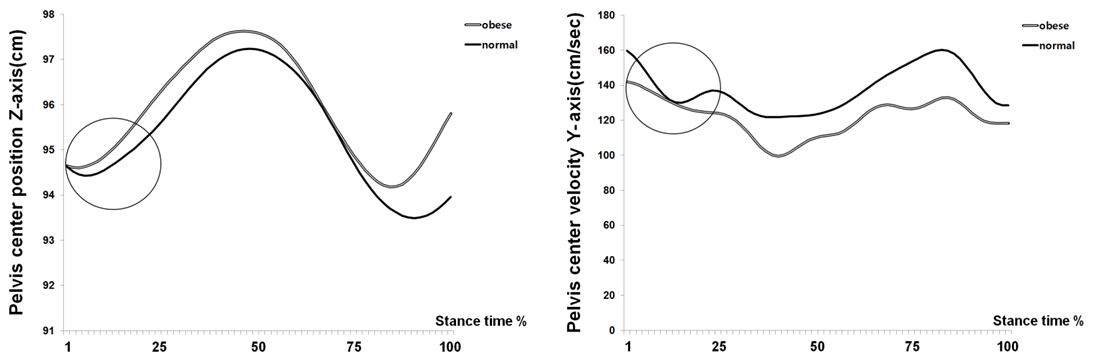
Anterior movement speed of the center of the pelvis was significantly higher in the control group (p<.001), while vertical change of the center of the pelvis was significantly higher in the obese group (p<.001). The change in kinetic variables with body weight during gait performance are shown in (Table 2).
|
Section |
Body weight group |
t |
p |
|
|
Normal |
Obese |
|||
|
PVF (N) |
622.09 ±85.76 |
955.48 ±149.61 |
4.323 |
.003** |
|
Normalized PVF |
1.14 ±0.07 |
1.17 ±0.05 |
.753 |
.473 |
|
Dimensionless leg |
23.34 ±2.54 |
31.16 ±5.96 |
2.697 |
.027* |
|
Normalized leg |
4.97 ±0.68 |
3.89 ±0.70 |
2.450 |
.040* |
PVF(N) produced during gait was significantly higher (p<.01) in the obese group (955.48±149.61 N) than in the control group (622.09±85.76 N). When the PVF was standardized by dividing with each partici- pant's weight, the control (1.14±0.07 N/BW) and obese (1.17±0.05 N/ BW) groups did not show a significant difference (p>0.5).
Leg lengths were standardized at 100% and the rate of change of leg length during the support period was analyzed. The obese group had a significantly lower (p<.05) rate of change of leg length (3.89±0.70%) than the control group (4.79±0.68%). The dimensionless leg stiffness analysis showed that the obese group (31.16±5.96) had a significantly higher (p<0.05) value than the control group (23.34±2.54).
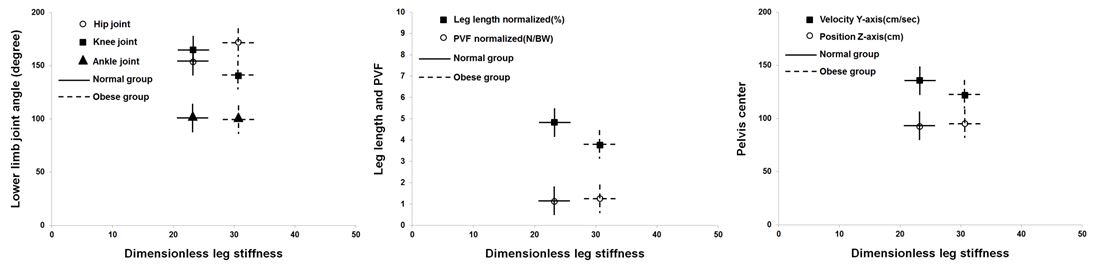
(Figure 5) illustrates the relationship between dimensionless leg stiff- ness and each of the kinetic variable. The X axis represents leg stiffness values, where the control group and the obese group have been given a constant value of 23.34±2.54 and 31.16±5.96, respectively. The Y-axis represents angle relationships by showing the changes in lower limb joint angles, leg lengths, PVF and the center of the pelvis. In the obese group, the pelvic joint extension, the knee joint flexion and the rate of change in leg length was shown to influence the dimensionless leg stiffness. Although the obese group showed a slower movement speed than the control group, the leg stiffness was higher in the obese group.
The spring-mass system can be used to explain the trajectory of COM and the typical "M" shape of the vertical ground reaction force, which was not possible with the previous inverted pendulum model (Geyer, Seyfarth, & Blickkhan, 2006; Whittington & Thelen, 2009). Besides, sports and clinical bio-dynamists focus on the role of stiffness on improving human exercise abilities and prevention of injuries (Butler et al., 2003). Although appropriate level of stiffness is crucial for carrying out move- ments (Butler et al., 2003; McMahon & Cheng, 1990), too little or too much stiffness can cause injuries (Butler et al., 2003). Therefore, this study investigated the relationship between leg stiffness and kinetic variables and how it is modulated by body weight, since gait function is important in daily activities involving exercising or moving.
As explained above, dimensionless leg stiffness was evaluated using the rates of changes in the proportion of PVF (weight-standardized) or leg length. Our results suggest that the dimensionless leg stiffness was significantly higher in the obese group than in the control group.
Changes in the lower leg joint angles were compared and analyzed during the right-foot support period. The pelvic joint angle was signifi- cantly more extended in the obese group, the knee joint angle was significantly more flexed in the obese group and the ankle joint angle showed significantly higher plantar flexion than the control group. The obese group had a more upright position than the control group in the sagittal view, in line with the observations made by studies that reported that pelvic joint angle does not flex much when the heel touches the ground surface (Spyropoulos et al., 1991) and that there are no large changes in the flexion angle of the knee joint (DeVita & Hortobágyi, 2003). The pelvic joint angle was relatively more extended in the obese group after the support period, as shown in (Figure 3). In addition, the knee joint angle was more flexed in the control group during landing to reduce shock, and more extended during COM propulsion. However, in the obese group, knee flexion and propulsion-linked extension are not observed. Therefore, considering the lower limb movements, a rigid posture is observed in the obese group, to swiftly prepare for the next movement.
Compared to the speed of movement of the center of the pelvis and its vertical changes (as shown in (Figure 4)), the speed of movement of the anterior center of the pelvis was lower and the vertical changes were higher in the obese group. This result is in keeping with the findings of previous studies that reported that the stride length, movement speed and the support time are slower and delayed in the obese group (McGraw et al., 2000; DeVita & Hortobágyi, 2003; Messier, 1994; Messier, Loeser, Hoover, Semble, & Wise, 1992; Spyropoulos et al., 1991). The rate of change in leg length from COP to center of pelvis was significantly higher in the control group. This result is similar to the results from the study by Slider et al. (2015), which reported that the rate of change in leg length decreased with an increase in weight bearing in participants while running.
From the weight standardization perspective, the accumulated weight in the obese group can prove to be a heavy load on the lower limb during gait performance. The neuromuscular effects on the lower limb can by readjusted to each one's weight to minimize the weight load (DeVita & Hortobágyi, 2003). However, the previous stiffness evaluation method did not take into account the recent theories and was solely explained by the direct correlation between body mass and PVF/stiffness (Farley et al., 1993). In this study, the N value of PVF of the obese group before weight standardization was significantly higher than that in the control group. Although leg stiffness cannot be explained in simple terms, weight standardization in the obese and control groups were not significantly different.
Based on the results shown in (Table 1 and Table 2), the relationship between constant dimensionless leg stiffness and kinetic variables in both groups were investigated as shown in (Figure 5). PVF was not correlated with leg stiffness. Although the anterior movement speed of the center of the pelvis was slower in the obese group, leg stiffness was significantly higher. On the other hand, changes in lower limb joint angles showed that extension of the knee and pelvic joints increase the vertical changes of the center of the pelvis, in turn decreasing the rate of change of leg length.
During gait performance, the obese group had a relatively higher restriction from the muscles, greater decrease in movement and different propulsion functions compared to the control group (Perry, 1992), which are regarded as important variables implicated in disease and/or injury of joints and musculoskeletal connective tissues (Felson & Zhang, 1998; Hochberg et al., 1995). The study by Grimston, Engsberg, Kloiber, & Hanley (1991) reported that an increase in leg stiffness compromises motor function and can cause pain or injury. The results of this study suggest that the obese group, due to increased body weight load, has a longer support time (DeVita & Hortobágyi, 2003) and decreased gait speed (Andriacchi, Ogle, & Galante, 1977; Ryew, Lee, & Hyun, 2013). Although the decrease in the range of motion of the lower limb joints in the obese group causes a decrease in both movement speed and stress on the lower limb by elevating the center of the pelvis, these changes are important variables that could potentially increase leg stiffness by causing further increase in the rigidity of the lower limbs.
Although leg stiffness increases with an increase in weight (McMahon & Cheng, 1990; Silder et al., 2015), gait speed (Brughelli & Cronin, 2008; Arampatzis, Brüggemann, & Metzler, 1999) as well as PVF during motion, an appropriate method to evaluate leg stiffness must be selected in case the gait involves a smaller rate of change of leg length with different weight loads on the lower limbs.
The purpose of this study was to investigate the relationship between dimensionless leg stiffness and kinetic variables in control and obese individuals. Our results show that the anterior speed of the center of the body was significantly higher in the control group than in the obese group. However, the vertical change in the center of the pelvis was significantly greater in the obese group compared to the control group. The maximum vertical ground reaction force and dimensionless leg stiffness were both significantly higher in the obese group, while the standardized maximum vertical ground reaction force was not signifi- cantly different between the two groups. The rate of change of the leg length revealed that the obese group was more rigid than the control group. These findings indicate that dimensionless leg stiffness is directly correlated with the speed of the center of the body, maximum vertical ground reaction force and the rate of change of the leg length during gait performance.
References
1. Abdel-Aziz, Y. I. & Karara, H. M. (1971). Direct liner transformation from comparator into object space coordinates inclose-range photogrammetry. Proceeding of the Symposium on close-range Photogrammetry (1-18). Falls church, VA: American society of photogrammetry.
Crossref
Google Scholar
2. Andriacchi, T. P. & Mündermann, A. (2006). The role of ambulatory mechanics in the initiation and progression of knee osteoarthritis. Current Opinion in Rheumatology, 18(5), 514-518.
Crossref
Google Scholar
PubMed
3. Andriacchi, T. P., Ogle, J. A. & Galante, J. O. (1977). Walking speed as a basis for normal and abnormal gait measurements. Journal of Biomechanics, 10(4), 261-268.
Crossref
Google Scholar
PubMed
4. Arampatzis, A., Brüggemann, G. P. & Metzler, V. (1999). The effect of speed on leg stiffness and joint kinetics in human running. Journal of Biomechanics, 32(12), 1349-1353.
Crossref
Google Scholar
PubMed
5. Birrell, S. A. & Haslam, R. A. (2009). The effect of military load carriage on 3-D lower limb kinematics and spatiotemporal parameters. Ergonomics, 52(10), 1298-1304.
Crossref
Google Scholar
PubMed
6. Blum, Y., Lipfert, S. W. & Seyfarth, A. (2009). Effective leg stiffness in running. Journal of Biomechanics, 42(14), 2400-2405.
Crossref
Google Scholar
PubMed
7. Browning, R. C. & Kram, R. (2007). Effects of obesity on the biomechanics of walking at different speeds. Medicine and Science in Sports and Exercise, 39(9), 1632.
Crossref
Google Scholar
PubMed
8. Brughelli, M. & Cronin, J. (2008). Influence of running velocity on vertical, leg and joint stiffness. Sports Medicine, 38(8), 647-657.
Crossref
Google Scholar
PubMed
9. Bullimore, S. R. & Burn, J. F. (2006). Consequences of forward translation of the point of force application for the mechanics of running. Journal of Theoretical Biology, 238(1), 211-219.
Crossref
Google Scholar
PubMed
10. Butler, R. J., Crowell, H. P. & Davis, I. M. (2003). Lower extremity stiffness: implications for performance and injury. Clinical Biomechanics, 18(6), 511-517.
Crossref
Google Scholar
PubMed
11. Cavagna, G. A., Franzetti, P., Heglund, N. C. & Willems, P. (1988). The determinants of the step frequency in running, trotting and hopping in man and other vertebrates. The Journal of Physiology, 399(1), 81-92.
Crossref
Google Scholar
PubMed
12. Delp, S. L., Loan, J. P., Hoy, M. G., Zajac, F. E., Topp, E. L. & Rosen, J. M. (1990). An interactive graphics-based model of the lower extremity to study orthopaedic surgical procedures. IEEE Transactions on Biomedical Engineering, 37(8), 757-767.
Crossref
Google Scholar
13. DeVita, P. & Hortobágyi, T. (2003). Obesity is not associated with increased knee joint torque and power during level walking. Journal of Biomechanics, 36(9), 1355-1362.
Crossref
Google Scholar
PubMed
14. Donelan, J. M. & Kram, R. (2000). Exploring dynamic similarity in human running using simulated reduced gravity. Journal of Experimental Biology, 203(16), 2405-2415.
Crossref
Google Scholar
15. Farley, C. T. & Gonzalez, O. (1996). Leg stiffness and stride frequency in human running. Journal of Biomechanics, 29(2), 181-186.
Crossref
Google Scholar
PubMed
16. Farley, C. T., Glasheen, J. & McMahon, T. A. (1993). Running springs: speed and animal size. Journal of Experimental Biology, 185(1), 71 -86.
Crossref
Google Scholar
PubMed
17. Felson, D. T. & Zhang, Y. (1998). An update on the epidemiology of knee and hip osteoarthritis with a view to prevention. Arthritis & Rheumatism, 41(8), 1343-1355.
Crossref
Google Scholar
PubMed
18. Geyer, H., Seyfarth, A. & Blickhan, R. (2006). Compliant leg behaviour explains basic dynamics of walking and running. Proceedings of the Royal Society of London B: Biological Sciences, 273(1603), 2861- 2867.
Crossref
Google Scholar
PubMed
19. Grimston, S. K., Engsberg, J. R., Kloiber, R. & Hanley, D. A. (1991). Bone mass, external loads, and stress fracture in female runners. Journal of Applied Biomechanics, 7(3), 293-302.
Crossref
Google Scholar
20. Haslam, D. W. & James, W. P. (2005). Obesity. Lancet, 366(9492), 1197- 1209.
Crossref
PubMed
21. Hochberg, M. C., Lethbridge-Cejku, M., Scott Jr, W. W., Reichle, R., Plato, C. C. & Tobin, J. D. (1995). The association of body weight, body fatness and body fat distribution with osteoarthritis of the knee: data from the Baltimore Longitudinal Study of Aging. The Journal of Rheumatology, 22(3), 488-493.
Crossref
Google Scholar
PubMed
22. Hogan, N. & Sternad, D. (2009). Sensitivity of smoothness measures to movement duration, amplitude, and arrests. Journal of Motor Behavior, 41(6), 529-534.
Crossref
Google Scholar
PubMed
23. Hyun, S. H. & Ryew, C. C. (2014). Analysis of the gait characteristics and interaction among bilateral lower extremity joints according to shoe's heel heights in young women. Korean Journal of Sport Biomechanics, 24(4), 445-453.
Crossref
Google Scholar
24. Lai, P. P., Leung, A. K., Li, A. N. & Zhang, M. (2008). Three-dimensional gait analysis of obese adults. Clinical Biomechanics, 23(1), 2-6.
Crossref
Google Scholar
PubMed
25. Lee, M. H., Ranganathan, R. & Newell, K. M. (2011). Changes in objectoriented arm movements that precede the transition to goaldirected reaching in infancy. Developmental Psychobiology, 53(7), 685-693.
Crossref
Google Scholar
26. Lipfert, S. W., Günther, M., Renjewski, D., Grimmer, S. & Seyfarth, A. (2012). A model-experiment comparison of system dynamics for human walking and running. Journal of Theoretical Biology, 292(7), 11-17.
Crossref
Google Scholar
PubMed
27. McGraw, B., McClenaghan, B. A., Williams, H. G., Dickerson, J. & Ward, D. S. (2000). Gait and postural stability in obese and nonobese prepubertal boys. Archives of Physical Medicine and Rehabilitation, 81(4), 484-489.
Crossref
Google Scholar
PubMed
28. McMahon, T. A. & Cheng, G. C. (1990). The mechanics of running: how does stiffness couple with speed?. Journal of Biomechanics, 23(1), 65-78.
Crossref
Google Scholar
PubMed
29. McMahon, T. A., Valiant, G. & Frederick, E. C. (1987). Groucho running. Journal of Applied Physiology, 62(6), 2326-2337.
Crossref
Google Scholar
PubMed
30. Messier, S. P. (1994). Osteoarthritis of the knee and associated factors of age and obesity: effects on gait. Medicine and Science in Sports and Exercise, 26(12), 1446-1452.
Crossref
Google Scholar
PubMed
31. Messier, S. P., Loeser, R. F., Hoover, J. L., Semble, E. L. & Wise, C. M. (1992). Osteoarthritis of the knee: effects on gait, strength, and flexibility. Archives of Physical Medicine and Rehabilitation, 73(1), 29-36.
Crossref
PubMed
32. Perry, J. (1992). Gait analysis-normal and pathological function. New Jersey: SLACK.
Crossref
Google Scholar
33. Plagenhoef, S. C., Evans, F. G. & Abdelnour, T. (1983). Anatomical data for analyzing human motion. Research Quarterly for Exercise and Sport, 54(2), 632-635.
Crossref
Google Scholar
34. Ryew, C. C., Lee, A. R. & Hyun, S. H. (2013). The effect on the change of shoe's heel heights & body weights for dynamic balance during gait motions in women. Kinesiology, 15(3), 79-90.
Crossref
35. Silder, A., Besier, T. & Delp, S. L. (2015). Running with a load increases leg stiffness. Journal of Biomechanics, 48(6), 1003-1008.
Crossref
Google Scholar
PubMed
36. Silder, A., Delp, S. L. & Besier, T. (2013). Men and women adopt similar walking mechanics and muscle activation patterns during load carriage. Journal of Biomechanics, 46(14), 2522-2528.
Crossref
Google Scholar
37. Spyropoulos, P., Pisciotta, J. C., Pavlou, K. N., Cairns, M. A. & Simon, S. R. (1991). Biomechanical gait analysis in obese men. Archives of Physical Medicine and Rehabilitation, 72(13), 1065-1070.
Crossref
Google Scholar
PubMed
38. Stürmer, T., Günther, K. P. & Brenner, H. (2000). Obesity, overweight and patterns of osteoarthritis: the Ulm osteoarthritis study. Journal of Clinical Epidemiology, 53(3), 307-313.
Crossref
Google Scholar
PubMed
39. Teunissen, L. P., Grabowski, A. & Kram, R. (2007). Effects of independently altering body weight and body mass on the metabolic cost of running. Journal of Experimental Biology, 210(24), 4418-4427.
Crossref
Google Scholar
PubMed
40. Whittington, B. R. & Thelen, D. G. (2009). A simple mass-spring model with roller feet can induce the ground reactions observed in human walking. Journal of Biomechanical Engineering, 131(1), 011-013.
Crossref
Google Scholar
