Open Access, Peer-reviewed
eISSN 2093-9752
Open Access, Peer-reviewed
eISSN 2093-9752
Inje Lee
Sunghe Ha
Sae Yong Lee
https://dx.doi.org/10.5103/KJAB.2023.33.3.94 Epub 2023 September 21
Abstract
Objective: Few studies have investigated alterations of ground reaction force (GRF) in individuals with chronic ankle instability (CAI) compared with lateral ankle sprain (LAS) copers and healthy controls during walking. This study aimed to investigate differences in GRF variables among the CAI, LAS coper, and control groups.
Method: Eighteen individuals with CAI, 18 LAS copers, and 18 healthy controls were recruited for this study. All participants walked on 8-m walkway with a force plate three times. GRF data during stance phase were extracted and analyzed. The analysis of variance and ensemble curve analysis were used for statistical analyses of discrete points and time-series data respectively.
Results: The CAI group showed a greater loading rate (LR) and a shorter time to impact peak force than the other groups, as well as decreased vGRF from 56% to 65% in the stance phase than the control group. No significant differences were noted in the other variables.
Conclusion: Based on these findings, individuals with CAI should enhance their ability to create propulsion during the push-off phase and spend more time absorbing GRF to decrease the LR, which is considered one of risk factors for overuse injury and ankle osteoarthritis.
Keywords
Ankle Biomechanics Gait Kinetics Overuse injury
The term of chronic ankle instability (CAI) describes residual symptoms after a lateral ankle sprain (LAS), including the symptoms of repeat LAS, the sensation of ankle instability, and persistent ankle weakness (Gribble et al., 2014). Because CAI may be related to articular cartilage degeneration and talocrural joint osteoarthritis (Gross & Marti, 1999; Harrington, 1979), appropriately treating CAI is critical. Studies have re- ported a high prevalence of CAI, ranging from 32% to 74% (Anandacoomarasamy & Barnsley, 2005; Konradsen, Bech, Ehrenbjerg & Nickelsen, 2002). Researchers have therefore investigated the characteristics of CAI to prevent a LAS from deteriorating. Many studies on CAI have focused on bio- mechanics and neuromuscular controls. Monaghan, Delahunt, and Caulfield (2006) explored differences in ankle kinematics and kinetics between participants with CAI and controls from pre- and post-initial contact, whereas Drewes et al. (2009) in- vestigated joint angle alterations during gait in a CAI group compared with controls. Other research has focused on the perspectives of lower extremity alignment (Jeon et al., 2021) and neuromuscular control; including electromyography, nerve conduction velocity, and Hoffmann reflex studies (Delahunt, Monaghan & Caulfield, 2006; Hopkins, Brown, Christensen & Palmieri-Smith, 2009; Kim, Ingersoll & Hertel, 2012; Palmieri-Smith, Hopkins & Brown, 2009).
Ground reaction forces (GRF) are considered one of the representative risk factors for injury, and many research studies have sought to identify whether GRFs are linked with musculo- skeletal injuries (Hreljac, Marshall & Hume, 2000; Pohl, Hamill & Davis, 2009; Van der Worp, Vrielink & Bredeweg, 2016). In a previous study (Hreljac et al., 2000), the running-related lower extremity overuse injury group showed a higher vertical impact peak force and maximal vertical loading rate (LR) compared with the injury-free group. In other research, Pohl et al. (2009) reported a higher maximum instantaneous LR in female run- ners with a history of plantar fasciitis, whereas a meta-analysis by Van der Worp et al. (2016) demonstrated a higher LR in patients with a history of stress fractures and in all running-related injury types. Given these results, significant differences in GRFs exist between individuals with and without an injury history, regardless of causation, indicating that altered GRFs caused by an injury may negatively affect musculoskeletal conditions. Although reports have documented altered GRFs in individuals with CAI compared with LAS copers and con- trols (Bigouette, Simon, Liu & Docherty, 2016; Brown, Padua, Marshall & Guskiewicz, 2008), these data were respectively identified, and insufficient information on GRFs during walking persists among these populations. In addition, because the GRFs is also considered as one of important factors on func- tional performance such as the propulsion and power, it needs to be investigated in the CAI population. Therefore, this study aimed to investigate altered GRFs in individuals with CAI compared with LAS copers and healthy controls during walking. We hypothesized that individuals with CAI have greater GRF and LR values and a shorter time to peak force than LAS copers and healthy controls while walking.
1. Participants
This investigation was a case-control study with three groups. A total of 54 recreationally active young adults were recruited. All participants were assigned in equal numbers to the CAI, LAS coper, and control groups based on criteria from previous studies (Gribble et al., 2014; Wikstrom & Brown, 2014). Partici- pants who met the criteria from a position statement of the International Ankle Consortium were assigned to the CAI group (Gribble et al., 2014), whereas those who met the criteria of LAS coper and had a history of LAS were allocated to the LAS coper group (Wikstrom & Brown, 2014). The control group consisted of healthy individuals who never experienced LAS. We used questionnaires such as the Ankle Instability Instru- ment and the Foot and Ankle Ability Measure to distinguish the condition of ankle instability. Within 3 months before study enrollment, all participants engaged in exercise sessions at least 3 days per week with a total of 90 minutes. <Table 1> shows the demographic characteristics of participants. The Institutional Review Board of XXX University approved this study, and all participants provided written informed consent (#XXX).
|
Variables |
CAI (n=18) |
COP (n=18) |
CON (n=18) |
F |
p |
Post-hoc |
|
Sex (M:F) |
10:8 |
11:7 |
10:8 |
NA |
NA |
NA |
|
Age (year)a |
24.61±2.75 |
26.00±4.56 |
26.17±2.33 |
1.165 |
0.320 |
NA |
|
Height (cm)a |
172.98±7.95 |
173.36±7.45 |
172.19±8.22 |
0.104 |
0.902 |
NA |
|
Weight (kg)a |
67.82±14.64 |
66.87±10.34 |
63.30±11.15 |
0.688 |
0.507 |
NA |
|
AII (NO of yes)a |
7.39±1.29 |
2.56±1.04 |
0 |
276.669 |
<0.001* |
CAI > COP > CON |
|
FAAM-ADL (%)a |
82.58±7.81 |
99.61±0.99 |
100 |
86.255 |
<0.001* |
CAI > COP, CON |
|
FAAM-S (%)a |
68.06±9.84 |
99.21±2.31 |
100 |
175.584 |
<0.001* |
CAI > COP, CON |
|
LAS history (NO)a |
3.44±0.86 |
1.11±0.32 |
0 |
199.484 |
<0.001* |
CAI > COP > CON |
|
a Values are expressed as mean ± standard
deviation *p < 0.001 Abbreviations: ADL, activities of
daily living; AII, ankle instability instrument; CAI, chronic ankle
instability; CON, control; COP, LAS coper; F, female;
FAAM, foot and ankle ability measure; LAS, lateral ankle sprain; M, male; NA,
not applicable; NO, number; S, sport |
||||||
2. Procedures
After completing questionnaire screening and group allo- cation, all participants followed instructions to conduct a warm-up session for 5 minutes and practice walking for 5 minutes. All GRF data were collected using Vicon Nexus (Vicon Motion Systems, Oxford Metric, Oxford, UK) and a force plate (AMTI, Watertown, MA, USA) embedded in an 8-m walkway with a sampling rate of 1,000 Hz. Each individual was instructed to walk at a speed of 1.34 m/s with a range of 0.07 m/s (± 5%) and wore the same model of running shoes (Falcon Elite 2, Adidas AG, Germany) to control differences among conditions of running shoes (Drewes et al., 2009). Participants walked until obtaining three valid trial data points for gait based on the following criteria: heel strike pattern, speed ranges, and foot position in the center of a force plate during the stance phase (the affected limb of the CAI group; the dominant limb of the control group).
3. Data processing
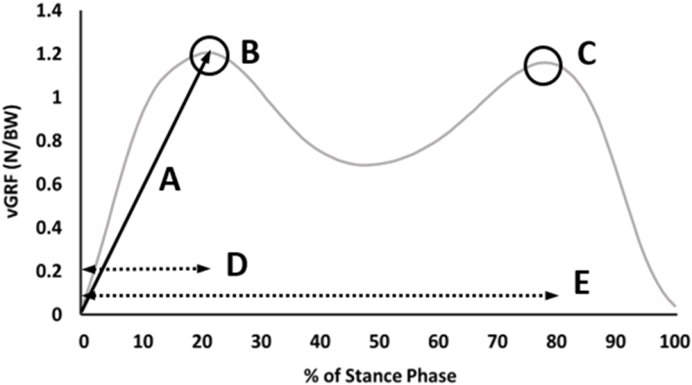
All data processing was conducted using Visual 3D V6 (C-Motion, Germantown, MD, USA). We used and analyzed GRF data throughout the stance phase from heel strike to toe off. A heel strike, which is the start of the stance phase, was identified when vertical GRF (vGRF) exceeded 20 N, whereas a toe off, which is the finish of the stance phase, was identified when vGRF was less than 20 N (Pamukoff, Lewek & Blackburn, 2016). A total of three stance phases of three trials, one stance phase of each trial, were extracted. All GRF data were low-pass filtered using a fourth-order Butterworth filter with a cutoff of 13 Hz and normalized by the body weight of the participant. Cutoff points for the low-pass filter were computed using power spectral density with a criterion of 99%. <Figure 1> presents the dependent variables of vGRF. The impact peak force was defined as the first peak vGRF during the stance phase, whereas the active peak force was considered to be the second peak vGRF throughout the stance phase. Peak medial GRF and peak lateral GRF were defined as the peak GRF value in medial and lateral direction, respectively, while walking. In addition, the mediolateral GRF value at initial con- tact was also exported. The time to impact and time to active peak force were defined as the time from a heel contact to the impact and active peak force, respectively. The LR was calculated using the following formula: impact peak force (N/ body weight)/time to impact peak force (seconds) (Pamukoff et al., 2016; Hunt et al., 2010). We normalized the stance phase to 0~100% to conduct ensemble curve analyses on time series data for vGRF: 0% indicated initial contact of the stance phase; 100% indicated toe off in the stance phase. Furthermore, we separated the stance phase to the following subphases: 1) early stance, 1~17% of stance; 2) midstance, 18~50% of stance; 3) terminal stance, 51~83% of stance; and 4) pre-swing, 84~ 100% of stance (Son, Kim, Seeley & Hopkins, 2019). Ensemble curves were plotted with mean and 90% confidence interval (CI) for each group using Microsoft Excel 2016 (Microsoft Corp., Redmond, WA, USA).
4. Statistical analysis
For time series data, ensemble curve analyses were used to compare the GRFs of the three groups using the mean values and 90% CI values. Significant differences were indicated when CI bands did not overlap. For analyses of discrete points, we used one-way analysis of variance (ANOVA) to identify mean differences among the three groups. When the omnibus test of ANOVA was significant, we used the Tukey method of post hoc analysis. The alpha level for ANOVA was set at 0.05.
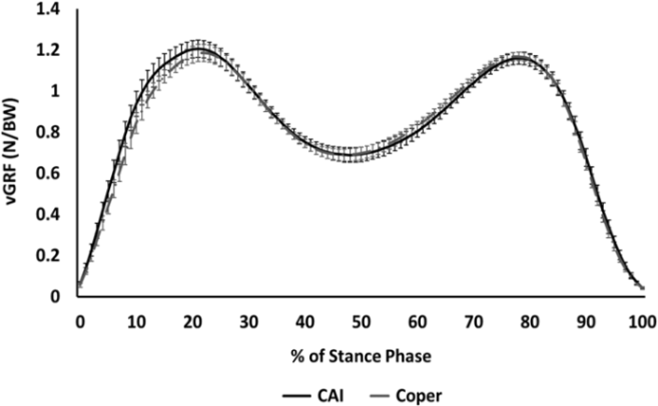
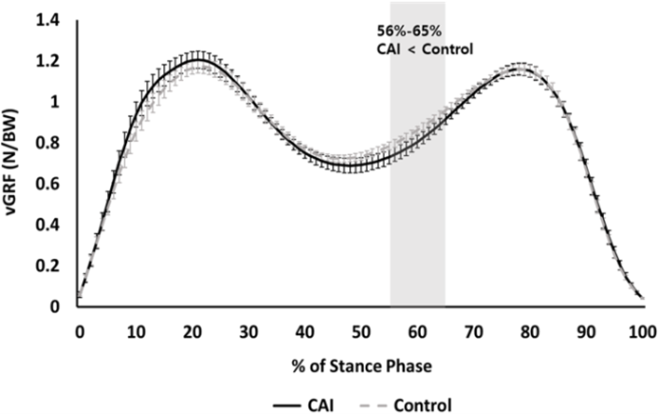
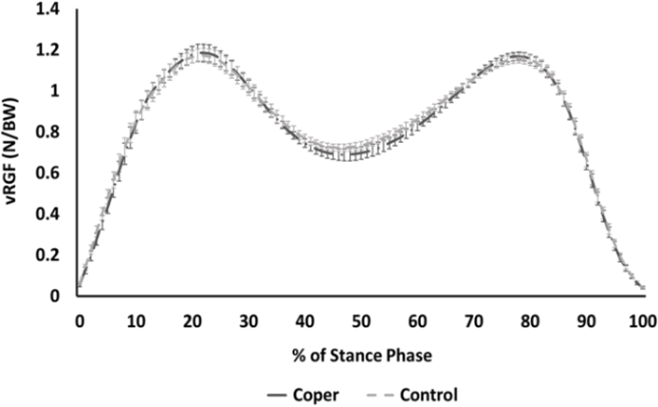
On one-way ANOVA, the three groups were equivalent in demographic characteristics, except for questionnaire scores and the number of LAS (Table 1). No significant difference occurred in gait speed among the three groups: CAI, 1.33±0.03; LAS coper, 1.34±0.03; and control, 1.34±0.02 (F = 0.391; p = 0.679). For ensemble curve analyses, vGRF was significantly different between the CAI and control groups from 56% to 65% of the stance phase during walking (Figure 3). However, no significant differences existed between the CAI and LAS coper groups (Figure 2) and between the LAS coper group and control group (Figure 4). <Table 2> presents the results for discrete points among the three groups. The CAI group exhibited the shorter time to impact peak force compared with the LAS coper (p = 0.021) and control (p = 0.002) groups. Moreover, individuals with CAI had a greater LR than LAS copers (p = 0.023) and healthy controls (p = 0.005). The other dependent variables did not significantly differ among the three groups (p > 0.05).
|
Variables |
CAI (n=18) |
COP (n=18) |
CON (n=18) |
F |
p |
Post-hoc |
|
Impact peak force |
1.23±0.11 |
1.20±0.10 |
1.20±0.09 |
0.459 |
0.635 |
|
|
Time to impact |
124.94±15.60 |
137.22±12.48 |
140.89±14.86 |
6.921 |
0.002* |
CAI < COP, CON |
|
Active peak force |
1.16±0.08 |
1.18±0.05 |
1.17±0.06 |
0.161 |
0.852 |
|
|
Time to active |
475.50±40.10 |
476.39±35.36 |
478.56±33.91 |
0.014 |
0.986 |
|
|
Peak medial GRF |
0.070±0.021 |
0.068±0.018 |
0.064±0.024 |
0.294 |
0.746 |
|
|
Peak lateral GRF |
0.038±0.018 |
0.043±0.025 |
0.038±0.015 |
0.448 |
0.642 |
|
|
ML GRF at IC (N/BW) |
0.006±0.008 |
0.004±0.008 |
0.001±0.007 |
2.733 |
0.075 |
|
|
Loading rate ([N/BW]/s) |
10.16±2.01 |
8.88±1.03 |
8.61±0.87 |
6.280 |
0.004* |
CAI > COP, CON |
|
Note: Values are expressed as mean ± standard deviation *p
< 0.01 Abbreviation: BW, body weight; CAI,
chronic ankle instability; CON, control; COP, LAS coper; GRF, ground reaction
force; IC, initial contact; ML, mediolateral |
||||||
We hypothesized that individuals with CAI would have greater GRFs and LR values in addition to a shorter time to peak force compared with LAS copers and healthy controls during walking. Our findings indicated that less vGRF was associated with increased LR and a shorter time to impact peak force during walking for individuals with CAI compared with the other groups; thus, the CAI group had alterations of GRFs.
Many researchers have identified altered vGRF throughout various tasks (Bigouette et al., 2016; Son et al., 2019; Caulfield & Garrett, 2004). Our findings were partially consistent with those of previous studies. We found that individuals with CAI showed less vGRF from 56% to 65% during walking compared with healthy controls, which may indicate that the CAI group produced less vGRF when heel off occurred. Other studies reported less plantar flexor and knee extensor moments in the CAI group during the early phase of cutting and jumping (Kim, Son, Seeley & Hopkins, 2018; Son, Kim, Seeley & Hopkins, 2017). Studies also reported less knee extensor moments during the terminal stance of walking in the CAI group (Son et al., 2019). These previous results may imply that the ability for power generation among individuals with CAI may be poorer than that for the healthy population because the early phases of cutting and jumping must create the propulsion to generate push-off. A poorer ability to generate power is quite similar to less vGRF in the CAI group during the terminal stance, given the laws of action and reaction. Therefore, in- dividuals with CAI need to learn to create propulsion through gait training and rehabilitation programs, including plyometric exercise.
Previous studies reported that patients with CAI moved with stiff joints (Doherty et al., 2016; Hoch, Farwell, Gaven & Weinhandl, 2015), which may cause a greater LR during walking compared with LAS copers and controls. Our findings demon- strated a greater LR in the CAI group than in the LAS coper and control groups during walking. Our results are in close agreement with those of the previous studies. In a previous study (Bigouette et al., 2016), the CAI group exhibited a greater LR than the control group during running. A greater LR is considered to be a risk factor for chronic injuries in performing various sports throughout the general population (Hreljac et al., 2000; Pohl et al., 2009; Van der Worp et al., 2016). Hreljac et al. (2000) identified differences in the LR and impact peak force between individuals with and without an overuse injury. In another study (Pohl et al., 2009), individuals with plantar fasciitis showed a greater maximum instantaneous LR than the injury-free population. Moreover, meta-analysis showed that a higher LR may cause stress fracture and all types of injury (Van der Worp et al., 2016). Given these results, in- dividuals with a greater LR and CAI symptoms may be at risk of musculoskeletal injury. In addition, we found that the time to impact peak force was shorter in the CAI group compared with the other groups, although no differences occurred in the impact peak force among three groups. This finding may represent a greater LR for individuals with CAI, in contrast to previous study results (Bigouette et al., 2016). Bigouette et al. (2016) identified a greater impact peak force, but not the time to impact peak force, in the CAI group compared with the non-CAI groups. These differences may be due to the different tasks required between walking and running. In summary, given the increased LR in the CAI group, individuals with CAI may need to absorb the shock from GRFs for a longer time than their current duration.
Altered GRF patterns in medial and lateral directions in the CAI population may suggest how to compensate for their ankle instability. Our results indicated no significant differences in mediolateral GRFs among the three groups. Our findings were similar to those of previous studies (Brown et al., 2008; Caulfield & Garrett, 2004). Brown et al. (2008) investigated biomechanical differences among individuals with functional instability and LAS copers in addition to those with mechanical instability. The three groups, including functional instability, mechanical instability, and LAS copers, did not produce GRFs in mediolateral directions during functional movement, such as walking, running, step down, and drop jump. Caulfield and Garrett (2004) also reported no differences in peak GRF between the CAI and control groups during landing tasks with single-leg jump. However, participants exhibited earlier timing of peak GRF in the lateral direction after initial contact. Although GRF magnitude is a crucial kinetic variable to dis- cover the characteristics of the CAI population, the timing of peak GRFs is also important. The time to peak GRF can provide insights into movement strategies performed by individuals with CAI, which may help in the development of injury pre- vention programs. Our study investigated only the time to impact and active peak force during walking. Therefore, future studies are needed to identify the altered timing of peak GRF in all directions in the CAI population during walking.
Our study had several limitations. First, because walking is a basic movement skill, our findings may be unable to ex- plain characteristics in other movement tasks. Second, our findings may explain only the GRF characteristics among the three groups because we did not provide other variables such as kinematics and electromyography. Third, our participants walked in controlled conditions, including shoes and speed. Given these limitations, future study may need to investigate the comprehensive biomechanics in these groups.
In conclusion, our findings indicated alterations of GRF patterns in the CAI group, which may be at risk of overuse injury and ankle osteoarthritis. Because of altered kinetic pat- terns, individuals with CAI should improve their power ability to create propulsion during the push-off phase and consider spending more time absorbing GRFs. In addition, further study on GRF may provide researchers and specialists in the sports medicine field with information about the use of GRFs to achieve movement efficiency in a specific population. Therefore, more studies on kinetics and kinematics of individuals with CAI are needed.
References
1. Anandacoomarasamym, A. & Barnsley, L. J. (2005). Long term outcomes of inversion ankle injuries. British Journal of Sports Medicine, 39(3), e14.
Google Scholar
2. Bigouette, J., Simon, J., Liu, K. & Docherty, C. L. (2016). Altered vertical round reaction forces in participants with chronic ankle instability while running. Journal of Athletic Training, 51(9), 682-687.
Google Scholar
3. Brown, C., Padua, D., Marshall, S. W. & Guskiewicz, K. (2008). Inidividuals with mechanical ankle instability exhibit dif- ferent motion patterns than those with functional ankle instability and ankle sprain copers. Clinical Biomechanics, 23(6), 822-831.
Google Scholar
4. Caulfield, B. & Garrett, M. (2004). Changes in ground reaction force during jump landing in subjects with functional instabiity of the ankle joint. Clinical Biomechanics, 19(6), 617-621.
Google Scholar
5. Delahunt, E., Monaghan, K. & Caulfield, B. (2006). Altered neuromuscular control and anlke joint kinematics during walking in subjects with functional instability of the ankle joint. The American Journal of Sports Medicine, 34(12), 1970-1976.
Google Scholar
6. Doherty, C., Bleakley, C., Hertel, J., Caulfield, B., Ryan, J. & Delahunt, E. (2016). Single-leg drop landing movement strategies in participants with chronic ankle instability compared with lateral ankle sprain 'copers'. Knee Surgery, Sports Traumatology, Arthroscopy, 24(4), 1049-1059.
Google Scholar
7. Drewes, L. K., McKeon, P. O., Paolini, G., Riley, P., Kerrigan, D. C., Ingersoll, C. D. & Hertel, J. (2009). Altered ankle kinematics and shank-rear-foot coupling in those with chronic ankle instability. Journal of Sport Rehabilitation, 18(3), 375-388.
Google Scholar
8. Gribble, P. A., Delahunt, E., Bleakley, C. M., Caulfield, B., Docherty, C. L., Fong, D. T. K., Fourchet, F., Hertel, J., Hiller, C. E., Kaminski, T. W., McKeon, P. O., Refshauge, K. M., Van der Wees, P., Vicenzino, W. & Wikstrom, E. A. (2014). Selection criteria for patients with chronic ankle instability in con- trolled research: A position statement of the International Ankle Consortium. Journal of Athletic Training, 49(1), 121-127.
Google Scholar
9. Gross, P. & Marti, B. (1999) Risk of degenerative ankle joint disease in volleyball players: Study of former elite athletes. International Journal of Sports Medicine, 20(1), 58-63.
Google Scholar
10. Harrington, K. D. (1979). Degenerative arthritis of the ankle secondary to long-standing lateral ligament instability. The Journal of Bone and Joint Surgery, 61(3), 354-361.
Google Scholar
11. Hoch, M. C., Farwell, K. E., Gaven, S. L. & Weinhandl, J. T. (2015). Weight-bearing dorsiflexion range of motion and landing biomechanics in individuals with chronic ankle instability. Journal of Athletic Training, 50(8), 833-839.
Google Scholar
12. Hopkins, J. T., Brown, T. N., Christensen, L. & Palmieri-Smih, R. M. (2009). Deficits in peroneal latency and electromechanical delay in patients with functional ankle instability. Journal of Orthopaedic Research, 27(12), 1541-1546.
Google Scholar
13. Hreljac, A., Marshall, R. N. & Hume, P. A. (2000). Evaluation of lower extremity overuse injury potential in runners. Medicine and Science in Sports and Exercise, 32(9), 1635-1641.
Google Scholar
14. Hunt, M. A., Hinman, R. S., Metcalf, B. R., Lim, B. W., Wrigley, T. V., Bowles, K. A., Kemp, G. & Bennell, K. L. (2010). Quadriceps strength is not related to gait impact loading in knee osteoarthritis. The Knee, 17(4), 296-302.
Google Scholar
15. Jeon, H. G., Ha, S., Lee, I., Kang, T. K., Kim, E. S. & Lee, S. Y. (2021). Differnces in static lower extremity alignment according to the history of lateral ankle sprain: Efficacy and limitation of static lower limb alignment measure- ment as a predictor of lateral ankle sprain. Korean Journal of Sport Biomechanics, 31(1), 1-15.
16. Kim, H., Son, S. J., Seeley, M. K. & Hopkins, J. T. (2018). Kinetic compensations due to chronic ankle instability during landing and jumping. Medicine and Science in Sports and Exercise, 50(2), 308-317.
Google Scholar
17. Kim, K. M., Ingersoll, C. D. & Hertel, J. (2012). Altered postural modulation of Hoffmann reflex in the soleus and fibularis longus associated with chronic ankle instability. Journal of Electromyography and Kinesiology, 22(6), 997-1002.
Google Scholar
18. Konradsen, L., Bech, L., Ehrenbjerg, M. & Nickelsen, T. (2002) Seven years follow-up after ankle inversion trauma, Scandinavian Journal of Medicine and Science in Sports, 12(3), 129-135.
Google Scholar
19. Monaghan, K., Delahun, E. & Caulfield, B. (2006). Ankle func- tion during gait in patients with chronic ankle instability compared to controls. Clinical Biomehcanics, 21(2), 168-174.
Google Scholar
20. Palmieri-Smith, R. M., Hopkins, J. T. & Brown, T. N. (2009). Peroneal activation deficits in persons with functional ankle instability, The American Journal of Sports Medicine, 37(5), 982-988.
Google Scholar
21. Pamukoff, D. N., Lewek, M. D. & Blackburn, J. T. (2016). Greater vertical loading rate in obese compared to normal weight yough adults. Clinical Biomchanics, 33, 61-65.
Google Scholar
22. Pohl, M. B., Hamill, J. & Davis, I. S. (2009). Biomechanical and anatomic factors associated with a history of plantar fas- ciitis in female runners. Clinical Journal of Sport Medicine, 19(5), 372-376.
Google Scholar
23. Son, S. J., Kim, H., Seelye, M. K. & Hopkins, J. T. (2017). Move- ment strategies among groups of chronic ankle instability, coper, and control. Medicine and Science in Sports and Exercise, 49(8), 1649-1661.
Google Scholar
24. Son, S. J., Kim, H., Seeley, M. K. & Hopkins, J. T. (2019). Altered walking neuromechanics in patients with chronic ankle instability. Journal of Athletic Training, 54(6), 684-697.
Google Scholar
25. Van der Worp, H., Vrielink, J. W. & Bredewe, S. W. (2016). Do runners who suffer injuries have higher vertical ground reaction forces than those who remain injury-free? A systematic review and meta-analysis. British Journal of Sports Medicine, 50(8), 450-457.
Google Scholar
26. Wikstrom, E. A. & Brown, C. N. (2014). Minimum reporting standards for copers in chronic ankle instability research. Sports Medicine, 44(2), 251-268.
Google Scholar
