Open Access, Peer-reviewed
eISSN 2093-9752
Open Access, Peer-reviewed
eISSN 2093-9752
Young-Tae Lim
Moon-Seok Kwon
http://dx.doi.org/10.5103/KJSB.2016.26.2.205 Epub 2016 July 16
Abstract
Purpose: The aim of this study was to analyze biomechanical factors and PMT (premotor time) of body muscles between elite college and amateur baseball players during the baseball batting motion.
Method: Kinematic and electromyographic data were obtained for 10 elite college baseball players and 10 amateur baseball players who participated in this study. All motion capture data were collected at 200 Hz using 8 VICON cameras and the PMT of muscles was recorded using a Delsys Trigno wireless system. The peak mean bat speed and the peak mean angular velocities of trunk, pelvis, and bat with PMT of 16 body muscles were computed. These kinematic and PMT data of both groups were compared by independent t-tests (p < .05).
Results: The pelvis, trunk, and bat showed a sequence of angular velocity value during baseball batting. The PMTs of right tibialis anterior, left gastrocnemius, external oblique, and erector spinae were significantly different between the two groups.
Conclusion: The PMT of body muscles was related to the shifting of body and rotation of the pelvis and the trunk segment, and this action can be considered the coordinated muscle activity of the lower and upper body.
Keywords
Biomechanical factors PMT EMG Baseball batting Angular velocity
Since 2014, professional baseball in South Korea has achieved game attendance record of over 6 million people each year, and the number of people playing in social baseball leagues increased rapidly from about 60,000 in 2012 to roughly 120,000 in 2014. Baseball has also established itself as one of the most popular sports played with a ball in Korea (Park, 2012; Her, Choi, & Park, 2013; Kim, Kim, Seo, & Lee, 2015). During a baseball game, batting and base running are major scoring skills demanded from the batters (Chun, 2012; Her et al., 2013). Bat speed and accuracy of impact during the batting motion are factors that determine the batter's hitting capabilities and they also affect the direction and distance of the hit ball (Chun, 2012). In other words, as the batter stands in the batter's box, the batter must identify the trajec- tory and the velocity of the ball thrown by the pitcher and accurately hit that ball with the bat to send it in the desired direction and distance. However, the batter's batting motion is an extremely difficult skill that involves determining the motion of the ball within a split second (appro- ximately 0.5 sec, which is the time taken by the ball thrown by a professional pitcher to reach the catcher) and quickly generate a bat motion for accurate ball hitting before the ball reaches the batter's lead foot (Lee & Kim, 2002; DeRenne, 2007; Her et al., 2013).
In a study by Han, Yoo, Chung, and Lee (1996), the professional baseball players group spent relatively more time than college baseball players group to achieve fast bat speed for accurate hitting and deter- mining the trajectory and velocity of ball thrown from the pitcher. Moreover, a study by Lee (2003) also found professional players to have faster bat speed than college players, while players with faster bat speed showed increased trunk rotational range of motion (ROM). Therefore, bat speed at the point of impact during baseball batting motion is determined by the coordination between the upper and lower body segments and linear and rotational motion of the bat (Welch, Banks, Cook, & Draovitch, 1995). Additionally, sequential rotational motion from the proximal to distal segment of the body not only increases the bat speed during batting motion in an effective manner, but also increases the momentum of the bat, which is one of the determining factors of the distance traveled by the ball after impact (Escamilla et al., 2009; Fleisig, Hsu, Fortenbaugh, Cordover, & Press, 2013).
Biomechanical studies were performed on the effects of sequential rotational movement that develops from the hips, trunk, and upper extremity segment during batting motion on bat speed (Race, 1961; Welch et al., 1995). Few precedent studies attempted to investigate the biomechanical properties of batting through electromyography (EMG) analysis on contraction activities of muscles that contribute to physical movement during batting motion (Szymanski & DeRenne, 2010; Reyes, Dickin, Crusat, & Dolny, 2011). Contraction activities of the thigh muscles in the back leg during the take back action of early batting motion, when the front leg is lifted and only the back leg supports the body weight, play an important role in maintaining the center of gravity. Moreover, they also act as dynamic force that increases the bat speed during batting motion after the take back action (Shaffer, Jobe, Pink, & Perry, 1993). Meanwhile, Escamilla et al. (2009) reported that in the take back motion, the shoulders showed greater rotational angle than the hips. Such batting motion was reported as the mechanism of physical motion for increasing physical rotational motion during batting through eccentric contraction of muscle and momentum of the bat (Welch et al., 1995). During the batting motion, in order to transfer the momentum achieved through physical rotational motion to the bat, muscles that were extended due to take back motion must be recruited for performance of quick trunk rotation in counter-clockwise direction in the bat acceleration phase, as the front foot that was lifted is touched down on the ground (Welch et al., 1995).
In addition, sequential and cooperative contraction activities of the lower body and trunk muscles are responsible for important functions of maintaining body stability and smooth transfer of power to the arms and the bat when performing physical linear motion in the direction of the bat motion and rotational motion of segments relative to the vertical axis (Welch et al., 1995; Katsumata, 2007; Dabbs et al., 2010; Nakata, Miura, Yoshie, Kanosue, & Kudo, 2013). Regarding this, Shaffer et al. (1993) reported that better batting skills meant faster contraction of lower body muscles during the batting motion. Moreover, Szymanski and DeRenne (2010) reported that batters with greater capability to recruit upper extremity muscles produced greater distance traveled by the ball during batting. Although few studies were performed on muscle recruitment and batting ability as shown above, studies on the order and timing of muscle recruitment in the upper and lower extremities based on characteristics of complex body motion that appears during batting motion are still lacking.
The present study aimed to compare the differences in batting motion between elite college baseball players and amateurs who play baseball in social leagues by analyzing the premotor time (PMT) of body muscles that contribute to the process of transferring momentum and power from the lower body to the upper torso and arms, as well as rotational velocity of body segments that affect bat speed in baseball batting motion.
1. Participants
The participants in the present study were 10 elite college baseball players with no history of musculoskeletal problems in the past 12 months (mean age = 22.2 ± 0.9 years, height = 179.9 ± 4.4 cm, mass = 82.1 ± 6.9 kg) and 10 amateur baseball league players with at least 3 years of experience (mean age = 26.2 ± 2.5 years, height = 173.4 ± 3.7 cm, mass = 75.7 ± 4.1 kg). The objectives of the study were suffi- ciently explained to the participants and they provided written consent form prior to the participation.
2. Experimental equipment
As shown in Table 1, the experimental equipment used in the present study for analysis of biomechanical data from baseball batting motion were 8 infrared high-speed cameras operating at 200 Hz (Vicon MX-T10S, Oxford Metrics, Oxford, UK), while Nexus 1.8 (Vicon, Oxford Metrics, Oxford, UK) was used for 3D data processing. For collection of data on PMT of body muscles, a 16-channel EMG equipment was used (Delsys Trigno wireless EMG system, sampling frequency = 1,000 Hz, gain = 1000, input impedance > 10 Ω, CMRR > 100 dB). All partici- pants performed batting motion using a batting tee, while light emitting diodes (LEDs; Visol Ink., Korea) were used as visual stimulation to signal the start of batting. An A/D box signaling device (VSAD-102-32C, Visol Ink., Korea) connected to LEDs, an EMG system, and 2 force platforms (OR6-7-1000, AMTI, USA) were connected to Giganet data collection device (Vicon Motion Systems, Oxford, UK) to generate a threshold signal of 3 V for synchronization of 3D biomechanical, ground reaction force, and EMG data (Table 1).
|
Equipment |
Model |
Country |
|
Motion capture |
MX-T10S |
Vicon (UK) |
|
Data acquisition |
Giganet |
Vicon (UK) |
|
Analysis software |
NEXUS 1.8 |
Vicon (UK) |
|
Polygon |
||
|
EMG equipment |
Trigno Wireless |
Delsys (USA) |
|
Force platform |
OR6-7-1000 |
AMTI (USA) |
3. Experimental procedures
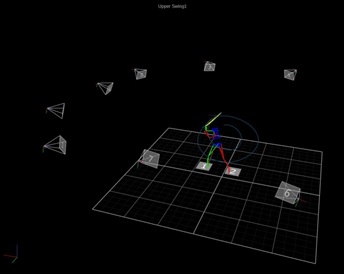
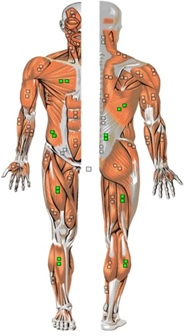
Prior to performing the batting motion, the participants were in- formed of the objectives of the experiment and instructed to wear black spandex shorts. The participants were given 10 min for stretching and batting practice. In this period, the swing trajectory of the bat was observed. Using this information and opinions of the participants, the height of the batting tee was adjusted to allow straight line hitting (Welch et al., 1995). An anthropometer (SM-324) was used to measure the necessary body segment lengths and circumferences from the participants using the scaling method by Zatsiosky, Selnyanov, and Chugunova (1990). Moreover, for collection of 3D data during baseball batting for motion analysis, round reflective markers (15 mm) were attached to the bat (bat grip and tip of bat) and the body, right/left toe on the shoes, calcaneus, lateral malleolus, medial malleolus, lateral tibia (half-way between ankle and knee), lateral epicondyle, medial epicondyle, lateral thigh (half-way between knee and hip), greater trochanter, anterior superior iliac spine, middle of posterior superior iliac spine, 3rd metacarpal head, lateral aspect of head of ulnar, lateral aspect of head of radius, humeral lateral epicondyle, humeral medial epicondyle, lateral acromion, upper ridge of ear, the middle of the forehead (glabella), 7th cervical vertebrae, and 12th thoracic vertebrae. Prior to conducting the baseball batting experiment, images were acquired while moving a T-shaped wand with 4 reflective markers in space, which were used to generate 3D coordinate values of the cameras. Afterward, the nonlinear transformation method was used to establish a global coordinate system, which was defined by the Y-axis of ball and bat motion, Z-axis in horizontal direction, and X-axis in anteroposterior direction of the body. Using the reflective markers attached to the body and bat, a local coordinate system was defined for calculation of segmental movements during baseball batting motion (Figure 1). During baseball batting motion, the body was defined as a series of segments from the head, trunk, hips, thighs, lower legs, upper arms, forearms, hands, to bat. Moreover, Delsys Trigno wireless EMG device was used to measure PMT of right and left rectus femoris, tibialis anterior, biceps femoris, gastrocnemius, pectoralis major, external oblique muscle of abdomen, latissimus dorsi, and erector spinae during base- ball batting motion. As shown in Figure 2, 16 locations where the electrodes for EMG measurements would be placed were prepared by removing the hair from the skin and cleaning the surface with alcohol. Prior to batting motion, the electrodes were placed and EMG data were measured for approximately 2 sec with the participants in upright posture. The participants received the start signal from the LED light to prepare their batting motion and performed the batting motion simultaneously with another LED signal. All participants performed batting motion until 3 sets of batting motion data necessary for the study were collected.
4. Data analysis
Three-dimensional coordinate data from the reflective markers attached to the body and bat during the batting motion of the partici- pants were filtered using a second-order Butterworth low-pass filter (Winter, 1990), with the cut-off frequency set to 6 Hz. During baseball batting, peak bat speed and peak rotational angular velocities of the pelvis, trunk, and bat that appear over all phases of batting were cal- culated using the Cardan orientation method, which involved differen- tiating relative orientation of distal segment coordinate system to proximal segment coordinate system by time.
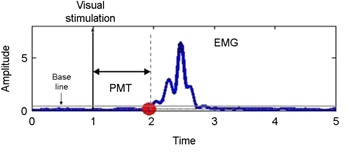
Batting motion EMG data collected at 1,000 Hz were filtered by a band-pass filter (10~500 Hz) using a data analysis system (PCI-6221; National Instruments, Austin, TX, USA), rectified, then linearized via 4th order Butterworth zero-phase filter. Subsequently, PMT of each muscle used during baseball batting was calculated using Matlab Program v 8.4. As shown in Figure 3, to calculate PMT of 16 muscles involved in the batting motion, the mean value of signal collected for 1 sec in ready position before the baseball batting motion was added the standard deviation multiplied by 3 (mean + 3SD) to establish the baseline. The first point in the EMG data measured during the batting motion that exceeded the baseline was defined as PMT of muscles and calculated (Hodges & Bui, 1996; Allison, 2003).
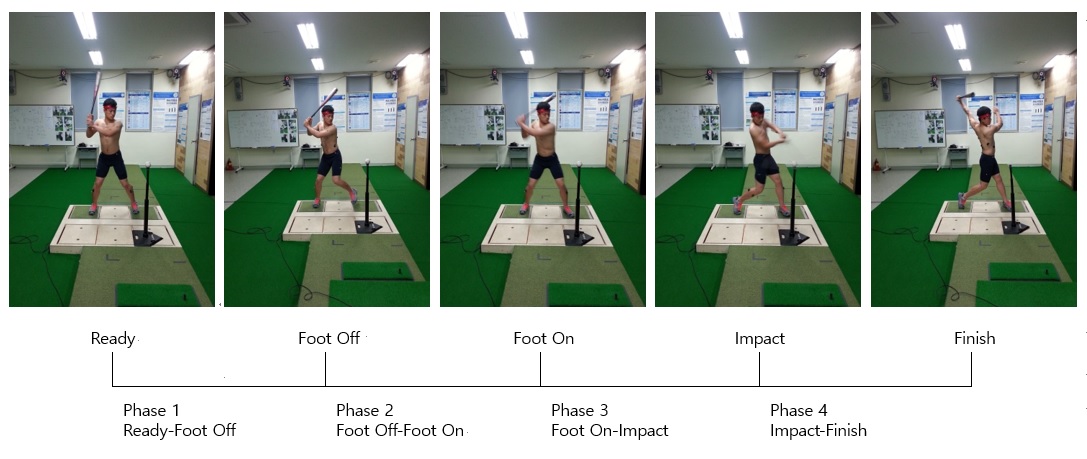
As shown in Figure 4, a camera and 2 AMTI force platforms were used to define events within the baseball batting motion based on baseline value of 10 N. Five critical events, defined were ① ready position; ② foot off, when the ground reaction force of the lead foot is minimal or <10 N; ③ foot on, when the lead foot touches down on the ground and the ground reaction force is ≥10 N; ④ impact, when the bat hits the ball; and ⑤ finish, when batting motion is completed. These 5 events were then used to define 4 phases.
5. Statistical analysis
SPSS 18.0 (SPSS Inc., Chicago, USA) was used to perform independent-samples t-test for comparison between the groups (elite college base- ball players and amateur baseball players) using the peak bat speed, rotational angular velocity of pelvis, trunk, and bat, and PMT of 16 muscles in the lower body and upper torso data acquired during baseball batting motion (α = .05).
|
Section |
Between elite group and amateur group |
Normalized by elite batting % |
||||||
|
Elite |
Amateur |
t |
p |
Elite |
Amateur |
t |
p |
|
|
Mean (± SD) |
Mean (± SD) |
Mean (± SD) |
Mean (± SD) |
|||||
|
Peak bat velocity (km/h) |
109.90 (10.6) |
90.50 (2.3) |
5.66 |
.000* |
1 |
83.14 (9.55) |
-27.19 |
.000* |
|
Peak pelvis angular velocity (deg/s) |
567.55 (93.73) |
479.32 (1.18) |
2.82 |
.011* |
1 |
87.21 (19.12) |
-14.26 |
.000* |
|
Peak trunk angular velocity (deg/s) |
810.06 (118.06) |
704.04 (9.02) |
2.60 |
.018* |
1 |
89.01 (16.98) |
-16.39 |
.000* |
|
Peak bat angular velocity (deg/s) |
1969.88 (190.54) |
1638.47 (160.83) |
4.20 |
.001* |
1 |
83.99 (12.53) |
-20.94 |
.000* |
|
Body Muscles |
Elite |
Amateur |
t |
p |
|
Mean |
Mean |
|||
|
Right rectus abdominis |
0.38±0.24 |
0.52±0.17 |
-1.57 |
.134 |
|
Left rectus abdominis |
0.44±0.14 |
0.36±0.61 |
0.40 |
.693 |
|
Right tibialis anterior |
0.28±0.17 |
0.59±0.15 |
-4.31 |
.000* |
|
Left tibialis anterior |
0.37±0.15 |
0.26±0.19 |
1.44 |
.168 |
|
Right quadriceps |
0.45±0.23 |
0.27±0.19 |
1.93 |
.069 |
|
Left quadriceps |
0.48±0.23 |
0.59±0.27 |
-0.93 |
.363 |
|
Right gastrocnemius |
0.39±0.29 |
0.50±0.06 |
-1.15 |
.264 |
|
Left gastrocnemius |
0.38±0.14 |
0.55±0.17 |
-2.46 |
.024* |
|
Right pectoralis major |
0.56±0.46 |
0.59±0.26 |
-0.19 |
.852 |
|
Left pectoralis major |
0.60±0.38 |
0.40±0.57 |
0.96 |
.351 |
|
Right external oblique |
0.58±0.25 |
0.62±0.14 |
-0.49 |
.630 |
|
Left external oblique |
0.18±0.46 |
0.65±0.27 |
-2.84 |
.011* |
|
Right latissimus dorsi |
0.57±0.22 |
0.65±0.16 |
-0.96 |
.348 |
|
Left latissimus dorsi |
0.41±0.28 |
0.59±0.22 |
-1.56 |
.135 |
|
Right erector spinae |
0.31±0.25 |
0.54±0.26 |
-1.99 |
.062 |
|
Left erector spinae |
0.56±0.20 |
0.24±0.30 |
2.75 |
.013* |
The results of analysis the batting motions of elite college and amateur baseball players hitting off a batting tee are shown in Table 2. Statistically significant differences existed in mean peak bat speed (t=5.66, p<.05), mean peak pelvis angular velocity (t=2.82, p<.05), mean peak trunk angular velocity (t=2.60, p<.05), and mean peak bat angular velocity (t=4.20, p<.05) between the two groups. Moreover, normalized by elite college baseball players group, amateur baseball players group showed statistically significant differences in mean peak bat speed (t=-27.19, p<.05), mean peak pelvis angular velocity (t= -14.26, p<.05), mean peak trunk angular velocity (t=-16.39, p<.05), and mean peak bat angular velocity (t=-20.94, p<.05).
The results of analysis of PMT of 16 muscles in the lower body and upper torso, which represent the contraction time of muscles during baseball batting motion, are shown in Table 3. With respect to the rectus femoris, no statistical significant difference was found between the two groups in PMT of right rectus femoris (t=-1.57, p>.05) and left rectus femoris (t=0.40, p<.05). With respect to the tibialis anterior, PMT of right tibialis anterior (t=-4.31, p<.05) showed a statistically significant difference between the two groups, but no statistically significant difference existed in PMT of left tibialis anterior (t=1.44, p>.05). No statistically significant difference was found in PMT of right biceps femoris (t=1.93, p>.05) and left biceps femoris (t=-0.93, p<.05). With respect to gastrocnemius, PMT of right gastrocnemius (t=-1.15, p<.05) did not show a statistically significant difference, but PMT of left gastrocnemius (t=-2.46, p>.05) did show a statistically significant difference. PMT of both right pectoralis major (t=-0.19, p>.05) and left pectoralis major (t=0.96, p<.05) showed no statistically significant difference between the two groups. With respect to the external oblique muscle of abdomen, PMT of right external oblique muscle of abdomen (t=-0.49, p<.05) did not show a statistically significant difference be- tween the two groups, but PMT of left external oblique muscle of abdomen (t=-2.84, p>.05) did show a statistically significant difference. PMT of right latissimus dorsi (t=-0.96, p>.05) and left latissimus dorsi (t=-1.56, p<.05) showed no statistically significant difference between the two groups. With respect to the erector spinae, PMT of right erector spinae (t=-1.99, p<.05) did not show a statistically significant difference between the two groups, but PMT of left erector spinae (t=2.75, p>.05) did show a statistically significant difference.
During baseball batting, quick bat movement is necessary to respond to the ball thrown by the pitcher and to hit it with accurate timing, which has been reported to be closely associated with rotational move- ments of the body segments and recruitment time of body muscles (Shaffer et al., 1993; Reyes et al., 2011). The ability to determine the movement of a thrown ball and peak bat speed generated at point of impact depends on batting skill level and these factors have been reported as indicators for determining the player's batting capabilities (Han et al., 1996). Among studies related to baseball batting speed, Lee (2003) measured the peak bat speed of Korean professional base- ball players and reported that the bat speed measured was approxi- mately 122 km/h. In the present study, when the peak bat speed was measured in college baseball players group and amateur baseball players group, who have different degrees of batting skills, a difference in bat speed of approximately 19 km/h was found between college baseball players group (110 km/h) and amateur baseball players group (91 km/h). Escamilla et al. (2009) reported a difference in bat speed between adult batter group (108 km/h) and adolescent batter group (90 km/h), while a study by Sgroi et al. (2015) showed that the pitch velocity of 420 pitchers aged 11 to 19 years was significantly affected by their age and height. It was determined that the bat speed during batting motion could appear differently according to repeatedly trained skill level that fits their own physical conditions and increase in the velocity of the ball thrown by the pitcher.
Physical movement performed from the start of baseball batting motion to the point of impact between the bat and the ball was reported to have a major effect on the peak bat speed value and the accuracy of impact (Kang, 2005; Chun, 2012). Welch et al. (1995) re- ported that in order to increase the bat speed during batting motion, the rotational movement of the pelvis and trunk must be in line with the rotational direction of the bat. Moreover, during the take back motion of the batting motion that prepares player to hit the ball, pelvic and trunk segments must be rotated on a vertical axis in counter¬clockwise direction, while in the phase when the bat is swung for impact, rotational movement in clockwise direction must be performed (Race, 1961; Escamilla et al., 2009). Rotational movement that starts from pelvic and trunk segments, which are the proximal segments of the body, to the arms, which are the distal segments of the body, and the bat must occur continuously. The increase in peak bat speed can be achieved through performance of sequential rotational movement that goes from large segments to small segments (Hay, 1993). Re- garding this, Welch et al. (1995) measured the rotational angular velo- city of the proximal segment (trunk) and of the bat during baseball batting motion and found that the peak angular velocity of trunk seg- ment and bat was approximately 714 deg/s and 1,588 deg/s, respec- tively. The peak angular velocity of the bat was achieved after the peak angular velocity of the trunk had occurred, showing a sequential peak angular velocity results that spread from proximal segment to the bat. In the present study, college baseball players group showed mean peak angular velocity of pelvis, trunk, and bat of approximately 568 deg/s, 810 deg/s, and 1,970 deg/s, respectively, while amateur baseball players group showed results of approximately 479 deg/s, 704 deg/s, and 1,638 deg/s, respectively. Therefore, the two groups of the present study showed sequential peak rotational angular velocity in the order from proximal segments to distal segments, as reported in precedent studies. Moreover, college baseball players group showed faster angular velocity of pelvis, trunk, and bat during batting motion than amateur players group. Comparing these results to the results of peak bat speed gene- rated at the point of impact, it was determined that the increase in the angular velocity of the pelvis and the trunk is an important factor for increased bat speed at the point of impact.
During baseball batting motion, a right-handed batter moves the lead foot to the target direction and quickly rotates the pelvis and trunk segments in counter-clockwise direction to perform the impact movement by moving the bat. At this time, rotational movement velocity of the body segments can appear differently, depending on the contraction activities of muscles in the upper and lower body (Shaffer et al., 1993; Reyes et al., 2011). During the baseball batting motion, rotational movement that starts slowly in large segments at the early stage moves towards the point of impact where the bat meets the ball and leads to fast rotation by small segments. The momentum and speed of the bat is greatly affected by such sequential rotational velocity generated by the body segments (Escamilla et al., 2009; Welch et al., 1995). Therefore, the increase in the momentum and the speed of the bat attributed to rotational movement of the body during the batting motion is generated from cooperative contraction of the upper and lower body, and such contraction activities of the muscles also affect the sequential rotational movement of each segment. The results of analysis of PMT of lower body muscles during the baseball batting motion showed that college baseball players group had faster PMT in the right rectus femoris, right tibialis anterior, left biceps femoris, and right and left gastrocnemius than amateur baseball players group. Moreover, among the upper body muscles, college baseball players group showed relatively faster PMT in the right and left external oblique muscle of abdomen, latissimus dorsi, and right erector spinae than amateur baseball players group. Lee (2003) analyzed hitting motions of baseball players and found that in the ready position, the players moved approximately 95% of their body weight to the back foot during the phase when the lead foot is moved, and then the weight is shifted quickly to the lead foot for impact to perform the rotational movement of the trunk. In the present study, as the analysis results from precedent studies on ready position of baseball players showed, college baseball players group had PMT of muscles used for weight shift, such as right tibialis anterior, left gastrocnemius, and left external oblique muscle of abdomen, that appeared sooner than in the amateur baseball players group during take back movement that shifted the center of gravity to the back foot in phase 1, from ready to foot-off (Table 3). Moreover, college baseball players group also showed faster PMT of the right rectus femoris, tibialis anterior, gastrocnemius, pec- toralis major, external oblique muscle of abdomen, latissimus dorsi, and erector spinae than amateur baseball players group. These results are interpreted as faster recruitment of muscles to maintain the center of gravity while moving the weight to the right foot during take back movement. In the case of upper body muscles, for smooth rotational movement of the trunk in counter-clockwise direction on vertical axis, contraction of the pectoralis major, external oblique muscle of abdo- men, latissimus dorsi, and erector spinae appeared faster than in the amateur baseball players group. Moreover, among the left leg muscles in the lead foot, faster PMT of quadriceps femoris and gastrocnemius was found in college baseball players group, while in the upper body, PMT of left external oblique muscle of abdomen, and latissimus dorsi appeared faster. In college baseball players group, trunk muscles on the left side, left external oblique muscle of abdomen and latissimus dorsi, showed faster PMT than muscles on the right side, which is interpreted as the outcome from generating peak bat speed by in- creasing the trunk rotational ROM (Welch et al., 1995). Therefore, for stable batting motion, body movement and balance through contraction of lower body muscles are very important (Chun, 2012). In addition, differences in body weight shift, rotational movement, and mainten- ance of body stability are observed based on differences in baseball batting skill levels. They may be highly associated with contraction time of body muscles used during baseball batting (Reyes et al., 2011; Szymanski & DeRenne, 2010).
The purpose of the present study was to compare the bat speed, body segment rotational velocity, and PMT of upper and lower body muscles during batting motion between college baseball players and amateur baseball players. Both groups showed peak angular velocities in the lowest to highest order of pelvis, trunk, and bat during batting motion, while amateur baseball players group showed significantly lower pelvis, trunk, and bat angular velocity and bat speed than college baseball players group. Moreover, college baseball players group showed faster PMT of right tibialis anterior, left gastrocnemius, and left external oblique muscle of abdomen than amateur baseball players group, whereas amateur baseball players group showed faster PMT of left erector spinae than college baseball players group. Body weight shift and the order of rotational movement during batting motion are greatly affected by the contraction of upper and lower body muscles, for which amateur baseball players are able to recruit muscle contraction involved in weight shift more quickly and concomitantly to increase the rotational velocity of proximal segments, pelvis and trunk, to perform batting similar to elite baseball players.
References
1. Allison, G. T. (2003). Trunk muscle onset detection technique for EMG signals with ECG artefact. Journal of Electromyography and Kinesi- ology, 13(3), 209-216.
Crossref
Google Scholar
PubMed
2. Chun, Y. J. (2012). The analysis on the changes in beginners batting movements through undergraduate baseball lectures. Korean Journal of Sport Biomechanics, 22(3), 277-284.
Crossref
3. Dabbs, N. C., Brown, L. E., Coburn, J. W., Lynn, S. K., Biagini, M. S. & Tran, T. T. (2010). Effect of whole-body vibration warm-up on bat speed in women softball players. Journal of Strength and Conditioning Research, 24(9), 2296-2299.
Crossref
Google Scholar
4. DeRenne, C. (2007). The scientific approach to hitting: research explores the most difficult skill in sport. San Diego, CA: University Readers, 254-255.
Crossref
5. Escamilla, R. F., Fleising, G. S., DeRenne, C., Taylor, M. K., Moorman, C. T. & Andrews, J. R. (2009). A comparison of age on baseball hitting kinematics. Journal of Applied Biomechanics, 25(3), 201-218.
Crossref
Google Scholar
PubMed
6. Fleisig, G. S., Hsu, W. K., Fortenbaugh, D., Cordover, A. & Press, J. M. (2013) Trunk axial rotation in baseball pitching and batting. Sport Biomechanics, 12(4), 324-333.
Crossref
Google Scholar
PubMed
7. Han, T. R., Yoo, M. J., Chung, S. G. & Lee, S. G. (1996). Three dimen- sional batting motion analysis of korean professional and college baseball players. The Korean Journal of Sports Medicine, 14(1), 22 -30.
Crossref
8. Hay, J. G. (1993). The biomechanics of sport. 4th ed. Englewood Cliffs (NJ): Prentice-Hall.
Crossref
9. Her, M. H., Choi, K. J. & Park, J. C. (2013). Kinematic analysis of pro- fessional baseball players batting motion. Korean Journal of Sport Science, 24(2), 213-222.
Crossref
10. Hodges, P. W. & Bui, B. H. (1996). A comparison of computer based-methods for the determination of onset of muscle contraction using electromyography. Electroencephalography & Clinical Neuro- physiology, 101(6), 511-519.
Crossref
Google Scholar
11. Kang, S. H. (2005). Comparative analysis of pull batting and push bat- ting motions in baseball. Korea Sports Research, 16(2), 165-174.
Crossref
12. Katsumata, H. (2007). A functional modulation for timing a movement: A coordinative structure in baseball hitting. Human Movement Science, 26(1), 27-47.
Crossref
Google Scholar
13. Kim, M. S., Kim, J. Y., Seo, J. W. & Lee, G. H. (2015). 2014 Sport white paper. Seoul: Korea Institute of Sport Science.
Crossref
14. Lee, Y. J. & Kim, J. T. (2002). The kinematic analysis of the pitching motion for the straight and curve ball. Korean Journal of Sport Biomechanics, 12(2), 109-130.
Crossref
Google Scholar
15. Lee, Y. S. (2003). The study of batting characteristics in elite baseball players. Korean Journal of Sport Biomechanics, 13(1), 173-184.
Crossref
Google Scholar
16. Nakata, H., Miura, A., Yoshie, M., Kanosue, K. & Kudo, K. (2013). Elec- tromyographic analysis of lower limbs during baseball batting. Journal of Strength and Conditioning Research, 27(5), 1179-1187.
Crossref
Google Scholar
PubMed
17. Park, K. N. (2012). Sociological factors, the population of adults with a baseball player background study on the relationship between consumer behavior. Korean Journal of Sports Science, 21(3), 251-262.
Crossref
18. Race, D. E. (1961). A cinematographic and mechanical analysis of the external movements involved in hitting a baseball effectively. Research Quarterly, 32(3), 394-404.
Crossref
Google Scholar
19. Reyes, G. F., Dickin, D. C., Crusat, N. J. & Dolny, D. G. (2011). Whole-body vibration effects on the muscle activity of upper and lower body muscles during the baseball swing in recreational baseball batters. Sports Biomechanics, 10(4), 280-293.
Crossref
Google Scholar
20. Sgroi, T., Chalmers, P. N., Riff, A. J., Lesniak, M., Sayegh, E. T., Wimmer, M. A., Verma, N. N., Cole, B. J. & Romeo, A. A. (2015). Predictors of throwing velocity in youth and adolescent pitchers. Journal of Shoulder and Elbow Surgery, 24(9), 1339-1345.
Crossref
Google Scholar
21. Shaffer, B., Jobe, F. W., Pink, M. & Perry, J. (1993). Baseball batting: An electromyographic study. Clinical Orthopaedics and Related Re- search, 292, 285-293.
Crossref
Google Scholar
PubMed
22. Szymanski, D. J. & DeRenne, C. (2010). The effects of small muscle training on baseball hitting performance: a brief review. Strength and Conditioning Journal, 32(6), 99-107.
Crossref
Google Scholar
23. Welch, C. M., Banks, S. A., Cook, F. F. & Draovitch, P. (1995). Hitting a baseball: A biomechanical description. The Journal of Orthopaedic and Sports Physical Therapy, 22(5), 193-201.
Crossref
Google Scholar
PubMed
24. Winter, D. A. (1990). Biomechanics and motor control of human move- ment. 2nd Edition. New York: John Wiley & Sons. Inc.
Crossref
Google Scholar
25. Zatsiorsky, V., Seluyanov, V. & Chugunova, L. (1990). In vivo body seg- ment inertial parameters determination using a gamma-scanner method. Biomechanics of Human Movement: Applications in Reha- bilitation, Sports and Ergonomics, 186-202.
Crossref
