Open Access, Peer-reviewed
eISSN 2093-9752
Open Access, Peer-reviewed
eISSN 2093-9752
Geun-Hyuk Lee
Jai-Jeong Kim
Sung-Sun Kang
Ah-Reum Hong
Jae-Moo So
http://dx.doi.org/10.5103/KJSB.2016.26.1.1 Epub 2016 April 20
Abstract
Objective: This study aimed to compare biomechanical data between elite and beginner cyclists during cycle pedaling by performing a comparative analysis and to provide quantitative data for both pedaling performance enhancement and injury prevention.
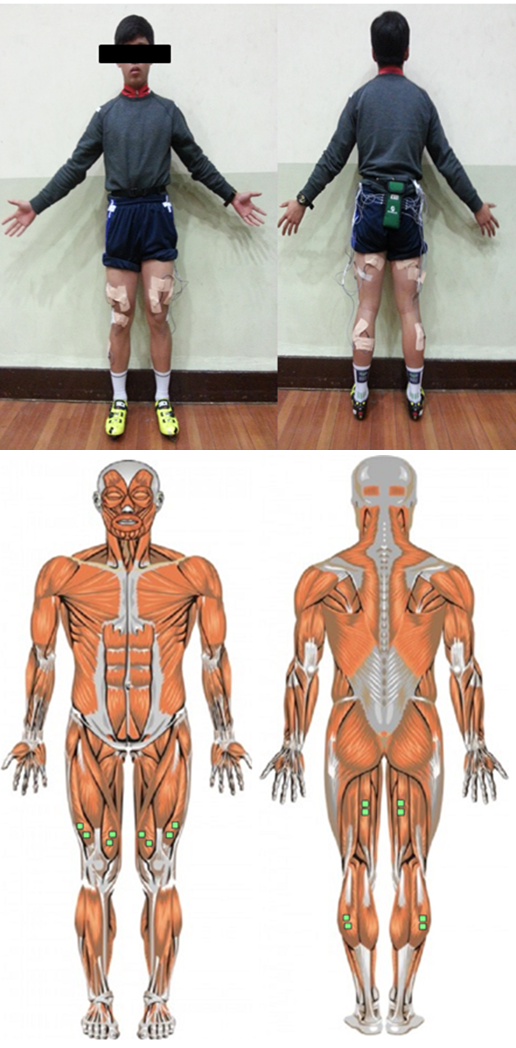
Methods: The subjects of this study included 5 elite cyclists (age: 18 ± 0 years, body mass: 64.8 ± 9.52 kg, height: 173.0 ± 4.80 cm) and 5 amateur cyclists (age: 20 ± 0 years, mass: 66.6 ± 2.36 kg, height: 175.6 ± 1.95 cm). The subjects pedaled on a stationary bicycle mounted on rollers of the same gear (front: 50 T and rear: 17 T = 2.94) and cadence of 90. The saddle height was adjusted to fit the body of each subject, and all the subjects wore shoes with cleats. In order to obtain kinematic data, 4 cameras (GR-HD1KR, JVC, Japan) were installed and set at 60 frames/sec. An electromyography (EMG) system (Telemyo 2400T, Noraxon, USA) was used to measure muscle activation. Eight sets of data from both the left and right lower extremities were obtained from 4 muscles (vastus medialis oblique [VMO], vastus lateralis oblique [VLO], and semitendinosus [Semitend], and lateral gastrocnemius [Gastro]) bilaterally by using a sampling frequency of 1,500 Hz. Five sets of events (0°, 90°, 180°, 270°, and 360°) and 4 phases (P1, P2, P3, and P4) were set up for the data analysis. Imaging data were analyzed for kinematic factors by using the Kwon3D XP computer software (Visol, Korea). MyoResearch XP Master Edition (Noraxon) was used for filtering and processing EMG signals.
Results: The angular velocity at 360° from the feet was higher in the amateur cyclists, but accelerations at 90° and 180° were higher in the elite cyclists. The amateur cyclists had greater joint angles at 270° from the ankle and wider knee joint distance at 0°, 180°, and 360° than the elite cyclists. The EMG measurements showed significant differences between P2 and P4 from both the right VLO and Semitend.
Conclusion: This study showed that lower body movements appeared to be different according to the level of cycle pedaling experience. This finding may be used to improve pedaling performance and prevent injuries among cyclists.
Keywords
Cycle Pedaling Cycle pedaling Skill level EMG
People's attention has been focused on leisure sports activities owing to economic development and increased leisure time in the modern society. Cycle, which is used in sports, is in the limelight as leisure equipment for health and fitness training, and its demand is increasing as an alternative transportation with environment friendliness and mobility and owing to completed bicycle roads around the four major rivers by government.
Cycle pedaling is a series of simple movements to per- form circular motion around the crankshaft, but marked differences in the pedaling performance may occur depen- ding on how the lower extremities act. Cycle pedaling is a rotational motion and is performed through the coord- ination of pressing, pulling, and pushing. When an indi- vidual passes a driving force by stepping down on the pedal during cycle pedaling, hip extensors, knee extensors, and plantar flexors serve as agonistic muscles to deliver the repetitive force to the pedals, whereas when raising the pedal up, hip flexors, knee flexors, and dorsi flexors serves as agonistic muscles to deliver the repetitive force to the pedals (Jun & Joo, 1996). The vertical transmission force delivered from the lower extremities is expressed as pedal power (Kang, Choi, Seo, Bae, & Tack, 2012). In particular, the pedal power allows the position of the knee to be perpendicular to the pedal, thereby reducing the potential loss of power and generating a great pedal power (Sanner & O'Halloranet, 2000). Pedaling power is the most basic and important factor in cycle performance (Atkinson, Peacock, St Clair Gibson, & Tucker, 2007). Therefore, efficient pedaling in cycling exercise is required.
Pedaling position during cycling is an important factor to prevent injuries and improve performance (Seo, Choi, Kang, Bar, & Tack, 2012). If the cycle rider position is improper, riding a bicycle may be unpleasant and painful. For cyclists, this may lead to injuries, which greatly impact their careers. If pain persists after riding a bike, postural correction is of paramount importance, and cycle pedals and feet should be correctly set up so that a load to be transmitted to the knee through the pelvis and thighs can act in an ideal state (Han, 2013). In their literature review on injuries and cyclists, Pruitt and Matheny (2006) emphasized that because pedaling is characterized by repetitive move- ments compared with other exercises, improper posture or loading can easily cause injuries. In their study, Bailey, Maillardet, and Messenger (2003) found no large difference in sagittal joint angle but found marked differences in knee joint angle in the frontal plane according to the pre- sence or absence of a history of overuse injury. Therefore, as differences in pedaling technique and muscle revelation may be expected between elite and amateur cyclists, the need for examining the activation of pedaling-related joints and muscles is suggested in order to assess the efficiency of the pedaling performance. In addition, scientific data are needed that can enhance pedaling performance and prevent injuries by achieving balanced posture of lower extremities that can efficiently produce power.
Thus, the present study aimed to compare biomechanical data between elite and amateur cyclists through a com- parative analysis, identify related errors and provide quan- titative data for pedaling performance enhancement and injury prevention.
1. Subjects
Five (5) cyclists from the Korea Cycle Federation (age: 18 ± 0 years, mass: 64.8 ± 9.52 kg, height: 173.0 ± 4.80 cm) were selected as the elite group. Meanwhile, five (5) students (age: 20 ± 0 years, mass: 66.6 ± 2.36 kg, height: 175.6 ± 1.95 cm) from K University who had cycling ex- perience were selected as the amateur group for this study. They were all able to perform cycle pedaling. The partici- pants were provided a full explanation about the purpose and content of this study before verbally consenting to participate in this study.
|
|
Age (years) |
Height (cm) |
Weight (kg) |
Career (years) |
|
Amateur (M ± SD) |
20±0 |
175.6±1.9 |
66.6±2.3 |
- |
|
Elite (M ± SD) |
18±0 |
173.0±4.8 |
64.8±9.5 |
2.4±0.9 |
2. Experimental procedure
The subjects pedaled on a stationary bicycle mounted on rollers, wherein the same gear ratio (front, 50 T and rear, 17 T = 2.94) was applied. Cadence representing the number of bicycle pedaling per minute was set at 90, or the average cadence of professional cyclists with reference to a study by Lucia, Hoyos, and Chicharro (2001). Based on the saddle height adjustment method proposed by Lemond, a professional cyclist, a value was calculated by multiplying each subject's inseam length by 0.883 (Lemond method) and used to adjust the saddle height to fit the body of each subject. The subjects wore shoes with cleats. As for the experimental equipment, 4 cameras (GR-HD1KR, JVC, Japan) were installed and set at 60 frames/sec of the camcorder speed, and 1/500 sec of the exposure time. In order to obtain kinematic data (angular velocity, angular acceleration, joint angle, and knee joint distance), recog- nition markers were attached to 12 control points on the right and left sides of the toe, heel, lateral malleolus, knee, anterior superior iliac spine, and shoulder. An electro- myography (EMG; Telemyo 2400T, NORAXON, USA) was used to measure muscle activation, and 8 sets of data from the right and left lower extremities were obtained from the vastus medialis obliquus (VMO), vastus lateralis obliquus (VLO), semitendinous (Semitend), and gastrocne- mius (GASTRO) bilaterally by using a sampling frequency of 1,500 Hz. In order to normalize the EMG data of each subject, the maximum voluntary isomeric contraction (MVIC) value of each subject was measured and standardized to calculate %MVIC value.
3. Analysis
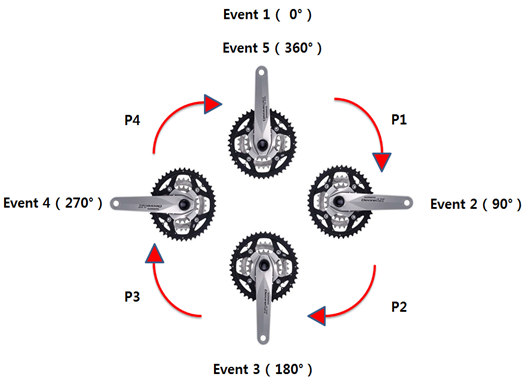
For data analysis, 5 sets of events (0°, 90°, 180°, 270°, and 360°) and 4 phases (P1, P2, P3, P4) were set up. Imaging data were analyzed by using the Kwon3D XP program (VISOL, Korea), and direct linear transformation utilizing the control point (2 × 2 × 1 m) with an already¬known spatial coordinate was used to calculate three-dimensional coordinates from the two-dimensional coordi- nates that were obtained by tuning after digitizing (Abdel¬Aziz & Karara, 1971). In order to remove errors occurring when digitizing, a Butterworth low-pass filter was used, wherein the cutoff frequency was set at 6 Hz. The right and left sides of each subject, and the front and back and the top and bottom were set as the X-, Y-, and Z-axes, respectively. The joint angles of the lower extremities during pedaling were defined as follows:
① hip joint angle: a relative angle between the torso and thigh
② knee joint angle: a relative angle between the thigh and lower leg
③ ankle joint angle: a relative angle between the lower leg and foot
④ knee joint distance: distance between the right and left knees based on the X-axis
MyoResearch XP Master Edition (NORAXON, USA) was used for filtering EMG signaling and then minimizing noises, and the resulting root mean square values were standardized as MVIC values to calculate %MVIC values.
4. Statistical processing
For statistical processing, the SPSS Statistics 22 was used to calculate and then tabulate the mean (M) and standard deviation (SD) of kinetic variables and muscle activity for the lower extremities according to the skill level during cycle pedaling. An independent sample t test was perfor- med to test the mean difference. The significance level was set at α = .05.
1. Analysis of angular velocity
The results of the angular velocity from the lower extre- mities according to the skill level during cycle pedaling are shown in (Table 2). The measured angular velocities at 90°, 180°, 270°, and 360° from the thighs in the amateur group were 183.8°/s, 97.4°/s, 173.5°/s, and 88.5°/s, respec- tively. Meanwhile, those at 90°, 180°, 270°, and 360° from the thighs in the elite group were 210.2°/s, 60.1°/s, 156.7°/s, and 123.2°/s, respectively. No significant differences were found between the two groups.
The angular velocities at 90°, 180°, 270°, and 360° from the lower legs in the amateur group were 112.9°/s, 96.5°/s, 144.8°/s, and 155.2°/s, respectively. Meanwhile, those at 90°, 180°, 270°, and 360° from the lower legs in the elite group were 122.1°/s, 120.6°/s, 157.4°/s, 138.7°/s, respectively. No significant differences were found between the two groups.
The angular velocities at 90°, 180°, 270°, and 360° from the feet in the amateur group were 100.4°/s, 162.2°/s, 89.4°/s, and 223.2°/s, respectively. Meanwhile, those at 90°, 180°, 270°, and 360° from the feet in the elite group were 127.9°/s, 169.6°/s, 105.9°/s, and 184.9°/s, respectively. Sig- nificant differences at 360° were found between the two groups.
|
|
90° |
180° |
270° |
360° |
||
|
Angular |
Thigh |
Amateur |
183.8 ± 20.2 |
97.4 ± 48.6 |
173.5 ± 31.1 |
88.5 ± 38.3 |
|
Elite |
210.2 ± 34.4 |
60.1 ± 32.6 |
156.7 ± 29.5 |
123.2 ± 55.8 |
||
|
t |
-2.092 |
2.017 |
1.239 |
-1.625 |
||
|
p |
0.051 |
0.059 |
0.231 |
0.121 |
||
|
Leg |
Amateur |
112.9 ± 26.1 |
96.5 ± 36.4 |
144.8 ± 35.7 |
155.2 ± 27.3 |
|
|
Elite |
122.1 ± 28.0 |
120.6 ± 30.0 |
157.4 ± 43.6 |
138.7 ± 40.3 |
||
|
t |
-0.760 |
-1.618 |
-0.711 |
0.421 |
||
|
p |
0.457 |
0.123 |
0.486 |
0.678 |
||
|
Foot |
Amateur |
100.4 ± 45.9 |
162.2 ± 55.6 |
89.4 ± 50.3 |
223.2 ± 47.6 |
|
|
Elite |
127.9 ± 45.8 |
169.6 ± 33.8 |
105.9 ± 38.9 |
184.9 ± 46.9 |
||
|
t |
-1.830 |
-0.358 |
-1.178 |
2.286 |
||
|
p |
0.084 |
0.724 |
0.254 |
0.035* |
||
2. Analysis of angular acceleration
The results of the angular accelerations according to the skill level during cycle pedaling are shown in (Table 3). The measured angular accelerations at 90°, 180°, 270°, and 360° from the thighs in the amateur group were 1120.2°/s2, 1881.2°/s2, 572.2°/s2, and 2335.9°/s2. Meanwhile, those at 90°, 180°, 270°, and 360° from the thighs in the elite group were 824.6°/s2, 2043.1°/s2, 903°/s2, and 2190.2°/s2, respectively. No significant differences were found between the two groups.
The measurements of the angular accelerations at 90°, 180°, 270°, and 360° from the lower legs in the amateur group were 1489.9°/s2, 1592.7°/s2, 1616°/s2, and 1670.7°/s2. Those at 90°, 180°, 270°, and 360° from the feet in the elite group were 874.6°/s2, 2050.7°/s2, 1855°/s2, and 1253.4°/s2, respectively. Significant differences were found at 180° between the two groups.
The measured angular accelerations at 90°, 180°, 270°, and 360° from the feet in the amateur group were found to be 1501.6°/s2, 1719.2°/s2, 2931.6°/s2, and 1797.9°/s2, re- spectively. Those at 90°, 180°, 270°, and 360° from the feet in the elite group were 2108.6°/s2, 1699.1°/s2, 2838.4°/s2, and 1827.4°/s2. No significant differences at 90° were found between the two groups.
|
|
90° |
180° |
270° |
360° |
||
|
Angular |
Thigh |
Amateur |
1120.2 ± 473.0 |
1881.2 ± 496.3 |
572.2 ± 409.0 |
2335.9 ± 519.1 |
|
Elite |
824.6 ± 257.8 |
2043.1 ± 504.2 |
903.0 ± 453.5 |
2190.2 ± 615.0 |
||
|
t |
1.148 |
-.724 |
-1.713 |
.573 |
||
|
p |
.266 |
.479 |
.104 |
.574 |
||
|
Leg |
Amateur |
1489.9 ± 487.9 |
1592.7 ± 387.1 |
1616.0 ± 400.4 |
1670.7 ± 480.7 |
|
|
Elite |
874.6 ± 386.6 |
2050.7 ± 465.1 |
1855.0 ± 359.6 |
1253.4 ± 623.7 |
||
|
t |
1.602 |
-2.393 |
-1.991 |
2.077 |
||
|
p |
.127 |
.028* |
.062 |
.052 |
||
|
Foot |
Amateur |
1501.6 ± 426.1 |
1719.2 ± 487.3 |
2931.6 ± 552.3 |
1797.9 ± 478.7 |
|
|
Elite |
2108.6 ± 372.2 |
1699.1 ± 361.5 |
2838.4 ± 678.8 |
1827.4 ± 528.5 |
||
|
t |
-2.835 |
.105 |
1.782 |
-1.904 |
||
|
p |
.011* |
.917 |
.092 |
.073 |
||
3. Analysis of joint angle
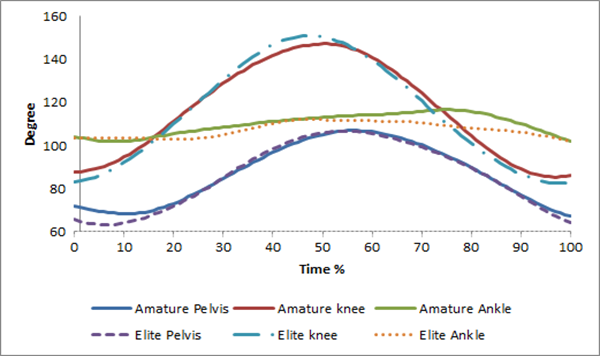
The results of the joint angles from the lower extremities according to the skill level during cycle pedaling are shown in (Table 4). When hip joint angles were measured, the results showed that hip joint angles at 0°, 90°, 180°, 270°, and 360° in the amateur group were 71.9°, 80.9°, 104.9°, 91.9° and 67.4°, respectively. Meanwhile, the hip joint angles at 0°, 90°, 180°, 270°, and 360° in the elite group were 66°, 78.4°, 106.8°, 93.9°, and 65.5°, respectively. No significant differences were found between the two groups.
When knee joint angles were measured, the results showed that the knee joint angles at 0°, 90°, 180°, 270°, and 360° in the amateur group were 87.6°, 123.7°, 147.1°, 108.2°, and 86.1°, respectively. Meanwhile, the knee joint angles at 0°, 90°, 180°, 270°, and 360° in the elite group were 83.2°, 120.7°, 151.7°, 108.2°, and 83.3°, respectively. No significant differences were found between the two groups.
|
|
|
0° |
90° |
180° |
270° |
360° |
|
Hip Joint Angle (°) |
Amateur |
71.9 ± 10.9 |
80.9 ± 8.2 |
104.9 ± 7.7 |
91.9 ± 7.9 |
67.4 ± 8.4 |
|
Elite |
66.0 ± 7.6 |
78.4 ± 8.2 |
106.8 ± 5.6 |
93.9 ± 9.2 |
65.5 ± 6.9 |
|
|
t |
1.412 |
.690 |
-.645 |
-.517 |
.564 |
|
|
p |
.175 |
.499 |
.527 |
.612 |
.580 |
|
|
Knee Joint Angle (°) |
Amateur |
87.6 ± 6.3 |
123.7 ± 5.4 |
147.1 ± 5.9 |
108.2 ± 4.9 |
86.1 ± 3.2 |
|
Elite |
83.2 ± 3.6 |
120.7 ± 4.9 |
151.7 ± 8.2 |
108.2 ± 6.9 |
83.3 ± 4.7 |
|
|
t |
1.887 |
1.334 |
-1.445 |
-.011 |
1.526 |
|
|
p |
.075 |
.199 |
.166 |
.991 |
.144 |
|
|
Ankle Joint Angle (°) |
Amateur |
104.2 ± 14.4 |
107.1 ± 7.3 |
113.2 ± 8.9 |
115.8 ± 6.2 |
102.2 ± 10.5 |
|
Elite |
103.7 ± 7.3 |
102.1 ± 5.1 |
112.1 ± 7.9 |
109.8 ± 4.9 |
102.7 ± 7.1 |
|
|
t |
.095 |
1.791 |
.287 |
2.424 |
-.107 |
|
|
p |
.925 |
.090 |
.777 |
0.026* |
.916 |
When ankle joint angles were measured, the results showed that the ankle joint angles at 0°, 90°, 180°, 270°, and 360° in the amateur group were 104.2°, 107.1°, 113.2°, 115.8°, and 102.2°, respectively. The ankle joint angles at 0°, 90°, 180°, 270°, and 360° in the elite group were 103.7°, 102.1°, 112.1°, 109.8°, and 102.7°, respectively. Significant differences in joint angle at 270° were found between the two groups.
4. Analysis of knee joint distance
The results of knee joint distance according to the pedaling skill level during cycle pedaling are shown in (Table 5). When knee joint distances were measured, the results showed that the knee joint distances at 0°, 90°, 180°, 270° and 360° in the amateur group were 34.55, 32.19, 35.17, 32.85, and 34.56 cm, respectively. The knee joint distances at 0°, 90°, 180°, 270°, and 360° in the elite group were 30.12, 30.32, 31.15, 31.12, and 31.17 cm, re-spectively. Significant differences at 0°, 180°, and 360° were found between the two groups.
|
|
0° |
90° |
180° |
270° |
360° |
|
Amateur |
34.55 |
32.19 |
35.17 |
32.85 |
34.56 |
|
Elite |
30.12 |
30.32 |
31.15 |
31.12 |
31.17 |
|
t |
.811 |
.687 |
.301 |
.313 |
.264 |
|
p |
.002* |
.187 |
.001* |
.169 |
.001* |
5. Analysis of EMG
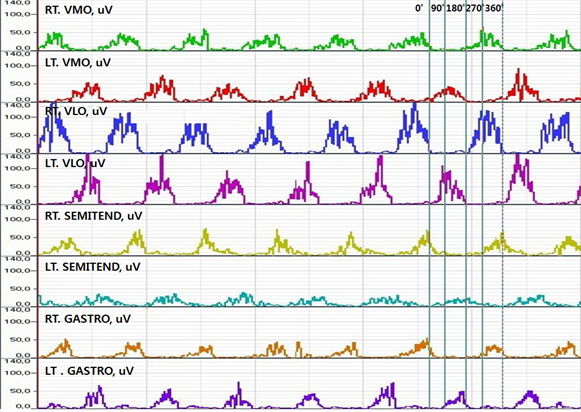
The results of EMG according to the skill level during cycle pedaling are shown in (Table 6). The EMG activity pattern raw data of one subject in the elite group are shown in (Figure 4).
The %MVIC integrated EMG (IEMG) from the VMO at P1, P2, P3, and P4 in the amateur group were respectively 22.7%, 9.3%, 12%, and 21.2% for the left lower extremity, and 21.2%, 15%, 15.7%, and 9% for the right lower extre- mity. Those in the elite group were respectively 28.1%, 21.1%, 12.4%, and 19.1% for the left lower extremity, and 29.4%, 16.8%, 14.2%, and 10.7% for the right lower extr- mity. No significant differences were found between the two groups.
The %MVIC IEMG from the VLO at P1, P2, P3, and P4 from the VLO in the amateur group were respectively 18.3%, 8.7%, 6%, and 8.8% for the left lower extremity, and 12.1%, 19.2%, 18.7%, and 14.2% for the right lower extremity. Those in in the elite group were respectively 22.3%, 11.1%, 9.8%, and 12.6% for the left lower extremity, and 18.5%, 24.5%, 29%, and 16% for the right lower extre- mity. Significant differences at P2 and P4 from the right lower extremity were found between the two groups.
|
|
P1 (Left) |
P2 (Left) |
P3 (Left) |
P4 (Left) |
P1 (Right) |
P2 (Right) |
P3 (Right) |
P4 (Right) |
|
|
VMO |
Amateur |
22.7 |
9.3 ± 4.5 |
12.0 ± 0.6 |
9.4 ± 4.3 |
21.2 ± 10.7 |
15.0 ± 13.1 |
15.7 ± 7.6 |
9.0 ± 6.6 |
|
Elite |
28.1 |
21.1 ± 17.1 |
12.4 ± 16.3 |
19.1 ± 9.5 |
29.4 ± 11.7 |
16.8 ± 14.2 |
14.2 ± 14.2 |
10.7 ± 7.4 |
|
|
t |
-.728 |
-1.492 |
-1.472 |
-.821 |
.097 |
-.208 |
.115 |
-.385 |
|
|
p |
.487 |
.174 |
.215 |
.435 |
.925 |
.841 |
.911 |
.710 |
|
|
VLO |
Amateur |
18.3 |
8.7 ± 3.6 |
6.0 ± 1.9 |
8.8 ± 11.3 |
12.1 ± 8.1 |
19.2 ± 13.9 |
18.7 ± 8.8 |
14.2 ± 3.7 |
|
Elite |
22.3 |
11.1 ± 3.4 |
9.8 ± 7.5 |
12.6 ± 10.4 |
18.5 ± 22.4 |
24.5 ± 12.5 |
29.0 ± 13.3 |
16.0 ± 7.6 |
|
|
t |
-.367 |
-1.055 |
-1.965 |
-.852 |
-2.006 |
-.631 |
-.936 |
-2.420 |
|
|
p |
.723 |
.322 |
.112 |
.419 |
.106 |
.545 |
.377 |
.042* |
|
|
Semitend |
Amateur |
10.7 |
18.8 ± 20.1 |
13.7 ± 8.6 |
8.6 ± 4.8 |
11.1 ± 7.1 |
9.8 ± 5.2 |
8.5 ± 2.6 |
6.4 ± 2.9 |
|
Elite |
15.1 |
17.9 ± 6.1 |
21.5 ± 15.4 |
12.7 ± 8.8 |
16.7 ± 18.8 |
11.2 ± 8.4 |
27.0 ± 10.7 |
11.4 ± 8.7 |
|
|
t |
-1.868 |
.097 |
-.977 |
-.909 |
-1.457 |
-4.820 |
-1.670 |
-2.687 |
|
|
p |
.099 |
.925 |
.357 |
.390 |
.216 |
.001* |
.133 |
.049* |
|
|
GASTRO |
Amateur |
12.9 |
29.8 ± 10.9 |
25.7 ± 11.3 |
9.5 ± 2.5 |
18.2 ± 8.6 |
30.4 ± 7.9 |
27.2 ± 7.9 |
8.1 ± 1.4 |
|
Elite |
20.0 |
30.9 ± 11.9 |
20.9 ± 11.5 |
20.6 ± 16.2 |
23.2 ± 15.1 |
25.2 ± 12.9 |
25.0 ± 19.4 |
12.3 ± 5.7 |
|
|
t |
-1.216 |
-.077 |
.665 |
-1.508 |
-.754 |
.294 |
-.753 |
-1.595 |
|
|
p |
.259 |
.940 |
.525 |
.170 |
.473 |
.776 |
.473 |
.149 |
|
The %MVIC IEMG from Semitend at P1, P2, P3, and P4 in the amateur group were respectively 18.3%, 8.7%, 6%, and 8.8% for the left lower extremity, and 12.1%, 19.2%, 18.7%, and 14.2% for the right lower extremity. Those in the elite group were respectively 22.3%, 11.1%, 9.8%, and 12.6% for the left lower extremity and 18.5%, 24.5%, 29%, and 16% for the right lower extremity. Significant differ- ences at P4 from the right lower extremity were found between the two groups.
The %MVIC IEMG from GASTRO at P1, P2, P3, and P4 in the amateur group were respectively 12.9%, 29.8%, 25.7%, and 9.5% for the left lower extremity and 18.2%, 30.4%, 27.2%, and 8.1% for the right lower extremity. Mean- while, those in the elite group were respectively 20%, 30.9%, 20.9%, and 20.6% for the left lower extremity and 23.2%, 25.2%, 25%, and 12.3% for the right lower extremity. No significant differences were found between the two groups.
This study was conducted to compare kinetic variables during cycle pedaling between elite and amateur groups through a comparative analysis, and to determine pedaling errors based on the obtained results and thereby enhance performance and prevent injuries.
Cycle pedaling is a typical event involving circular move- ments of the lower extremities of the body around the drive shaft, in which the angular velocity or a measure of speed that an object is rotating relative to the reference point is important. In terms of the changes in the angular velocities measured in the present study, no significant differences were found when the feet were at 360°. How- ever, the angular velocity from the thighs was reduced in the amateur group, and the angular velocity from the feet was statistically significantly higher in the amateur group than in the elite group, revealing that the amateur cyclists used their feet more than the elite cyclists did. In addition, significant differences in the decline in angular velocities were observed between the two groups according to event time. This can predict differences in the patterns of pedaling between the two groups.
For angular accelerations, significant differences in the angular accelerations from the lower legs and feet, except for the thighs, were found between the two groups. The elite group quickly accelerated the feet at 90° and the lower legs at 180°, as compared with the amateur group. Angular acceleration refers to the physical quantity gene- rated when the moment of a force acts on an object in a circular movement, by which the rotational speed of an object is changed. Therefore, such differences in angular acceleration may indicate that although two groups per- formed pedaling at the same speed, the pattern or aspect might differ. Yuk, Kim, and Yoo (2002) described that the technique to exercise pedaling or power is due to muscle strength and the kinematic position of the lower extremities.
In the joint angles, no significant differences in hip joint and knee joint were found, as well as in the angular pat- terns, between the two groups. However, significant differ- ences at an ankle joint of 270° were found between the two groups. Based on the results of the related angular velocities and accelerations, the elite group was estimated to use more the movements of their thighs and lower legs while fixing the ankles than the amateur group. Compared with the elite group, the amateur group is believed to per- form pedaling by using the ankles more. The reason for this difference is considered to be because the elite group had a strategy for pedaling adapted to the body. Seo et al. (2012) reported that because the ranges of the move- ment of the hip and knee joints are fixed relative to the ankle joint, the movement of the ankle joint is great, which is consistent with that in the amateur group found in the present study. In their study, Yuk et al. (2002) reported that for the elite athlete group the angular changes in the ankle joint was nearly constant with changes in the speed of pedaling. However, for the non-athlete group, the angular changes in the ankle appeared smaller as the speed of pedaling was faster, which was interpreted that the angular changes in ankle joints acted effectively on cycle pedaling as the speed of pedaling increased. Therefore, in order to more clearly determine differences between the two groups according to joint angle, further studies on changes in the speed of pedaling or conditions (e.g., uphill and downhill) are considered necessary in the future.
The measurement of knee joint distances during pedaling showed differences in knee joint distance at 0°, 180°, and 360? between the two groups. Compared with the elite group, the amateur group had wider knee distances at the time when the lower extremities were maximally folded or unfolded. For efficient pedaling, the lower extremities are to move vertically in the frontal plane, but the amateur group did not do so and was likely to perform pedaling in an extroversive manner. This can be estimated that force and torque to be vertically generated are dispersed to the left and right, resulting in a difference in pedaling efficiency. In their study, Kang et al. (2012) reported that with regard to proper saddle height adjustment for optimal pedaling, the variability of knee joint angle in the frontal plane rather than knee joint angle in the sagittal plane had the highest correlation with pedal power. Therefore, such differences in knee joint distances may be closely related to pedaling efficiency and skill level. In addition, there are concerns that incorrect pedaling may lead to injuries due to improper loads leaning to the force vector direction or specific parts of the body (Holmes, Pruitt, & Whalen, 1994; Pruitt & Matheny, 2006). Park, Kwak, and Kim (2010) described that if incorrect training habits during cycling are mapped out in a more systematic and scientific way, it can prevent the medical risk factor for knee joint injuries. In conclusion, knee joint gaps can be utilized for pedaling performance and injury prevention.
The analysis of EMG during pedaling revealed significant differences at P4 from the right VLO, and P2 and P4 from the right Semitend. When dividing the pedaling cycle into raising and lowering sections, the elite group actively showed the muscles in all sections to be continuously in a circular movement. By contrast, in the amateur group, only P1 from the VMO was activated, similar to that in the elite group, and muscle activity became active in the lowering section only. Taken together with the kinematic factors, the pedaling patterns of the two groups are thought to possibly differ. In other words, it is estimated that the elite group continued to pedal with major muscles of the lower extremities, whereas the amateur group did not employ the major muscles of the lower extremities by pedaling with lowering direction only. Thus, the pattern of muscle activation was estimated to be different. Shin and Kim (2008) confirmed in an analysis of EMG according to pedaling direction that muscle activation differed according to changes in pedaling direction. In reality, the change in pedaling position may result in changes in the intensity and time of muscle activation, thereby determining opti-mal pedaling efficiency (Dorel, Couturier, & Hug, 2009; Matsumoto, Tokuyasu, & Ohba, 2009).
Based on our results, cycle pedaling is a series of simple movements for circular motion, but the lower extremity movement pattern was found to differ according to pedaling skill level. The elite athletes utilized power when pedaling backward, and the lower extremity alignment in the frontal plane was more close to the vertical, as compared with the amateur cyclists. Therefore, it is necessary to perform movements during cycle pedaling that can be effective rotational movements rather than pressing down the pedals. Further studies involving a various situations should be conducted in the future.
In the present study, we conducted a comparative analysis of cycle pedaling between elite and amateur cyclists to improve pedaling performance and prevent injuries during cycling. Our conclusions are as follows:
1. The angular velocity at 360° in the amateur group was higher than that in the elite group. The angular velocity in the elite group was constant, with changes of event time, whereas that in the amateur group was not constant and the decline in the angular velocity was great.
2. In terms of angular acceleration, the elite group more quickly accelerated the feet at 90° and the lower legs at 180° than the amateur group. Therefore, we can infer that the moment of pedaling power to perform a circular motion with lower extremity muscle strength differed between the two groups. Thus, the pedaling patterns also differed between the two groups.
3. No significant differences in hip and knee joint angles were found between the two groups. The patterns also did not differ, but ankle joint angle showed significant differences. We observed that the elite group had a strategy for pedaling that was adapted to the body.
4. The measurement of knee joint distances during pedaling showed differences in knee joint distance at 0°, 180°, and 360° between the two groups. The ama- teur group had wider knee gaps than the elite group at the time when the lower extremities were maxi- mally folded or unfolded. Force and torque to be vertically generated may be dispersed to the left and right, and incorrect pedaling may lead to injuries due to improper loads leaning to force vector direction or specific parts of the body.
5. Pedaling-related EMG analysis showed significant dif- ferences at P4 from the right VLO, and P2 and P4 from the right Semitend. We found changes in the intensity and time of the lower extremity muscle acti- vation according to the change of the pedaling pattern.
Further studies involving various situations that can occur during riding and a broad range of subjects in the future are suggested.
References
1. Abdel-Aziz, Y. & Karara, H. M. (1971). Direct linear trans- formation into object space coordinates in close-range photogrammetry, in proc. symp. close-range photo- grammetry. Urbana-Champaign, 1-18.
Crossref
Google Scholar
2. Atkinson, G., Peacock, O., Gibson, A. S. C. & Tucker, R. (2007). Distribution of power output during cycling. Sports Medicine, 37(8), 647-667.
Crossref
Google Scholar
3. Bailey, M. P., Maillardet, F. J. & Messenger, N. (2003). Kine- matics of cycling in relation to anterior knee pain and patellar tendinitis. Journal of Sports Sciences, 21(8), 649 -657.
Crossref
Google Scholar
PubMed
4. Dorel, S., Drouet, J. M., Couturier, A., Champoux, Y. & Hug, F. (2009). Changes of pedaling technique and muscle coordination during an exhaustive exercise. Medicine+ Science in Sports+ Exercise, 41(6), 1277.
Crossref
Google Scholar
5. Han, W. S. (2013). Sport science: Cycle fitting and Sport science. Sport Science, 124(0), 46-55
Crossref
Google Scholar
6. Holmes, J. C., Pruitt, A. L. & Whalen, N. J. (1994). Lower extre- mity overuse in bicycling. Clinics in Sports Medicine, 13(1), 187-203.
Crossref
Google Scholar
PubMed
7. Kang, D. W., Choi, J. S., Seo, J. W., Bae, J. H. & Tack, G. R. (2012). A study on trajectory and angle of knee joint in sagittal and Frontal plane during cycle pedaling. Korean Journal of Sport Science, 23(4), 794-801.
8. Lucia, A. L. E. J. A. N. D. R. O., Hoyos, J. E. S. Ú. S. & Chicharro, J. L. (2001). Preferred pedalling cadence in professional cycling. Medicine and science in sports and exercise, 33(8), 1361-1366.
Crossref
Google Scholar
PubMed
9. Matsumoto, S., Tokuyasu, T. & Ohba, K. (2009). A study on postural optimization for bicycle exercise based on electromyography. Artificial Life and Robotics, 14(2), 144-149.
Crossref
Google Scholar
10. Park, C. H., Kwak, Y. S. & Kim, T. U. (2010) Triathlon-related overuse injury and medical issues. Journal of Life Science, 20(2), 314-320.
Crossref
Google Scholar
11. Pruitt, A. L. & Matheny, F. (2006). Andy Pruitt S Complete Medical Guide for Cyclists. VeloPress.
Crossref
12. Sanner, W. H. & O'Halloran, W. D. (2000). The biomechanics, etiology, and treatment of cycling injuries. Journal of the American Podiatric Medical Association, 90(7), 354 -376.
Crossref
Google Scholar
PubMed
13. Seo, J. W., Choi, J. S., Kang, D. W., Bae, J. H. & Tack, G. R. (2012). Relationship between lower-limb joint and muscle activity due to saddle height during cycle pedaling. Korean Journal of Sport Biomechanics, 22(3), 357-363.
Crossref
14. Shin, E. S. & Kim, H. J. (2008). Electromyographic analysis of a uphill propulsion of a bicycle by forward • back- ward pedaling. Korean Journal of Sport Biomechanics, 18(4), 171-177.
Crossref
Google Scholar
15. Yuk, S. S., Kim, T. Y, & Yoo. K. S. (2002). Kinematic and electromyographic analysis of lower limb to cycling. Journal of Sport and Leisure Studies, 18(2), 1231-1243.
Crossref
