Open Access, Peer-reviewed
eISSN 2093-9752
Open Access, Peer-reviewed
eISSN 2093-9752
Ki Han Park
Kew Wan Kim
Chol Hee Kim
http://dx.doi.org/10.5103/KJSB.2016.26.1.101 Epub 2016 April 20
Abstract
Objective: The purpose of this study was to investigate the effect of leg length discrepancy (LLD) on the human body during gait and standing posture.
Methods: The study group comprised of 17 adult participants with LLDs of <1 cm. LLDs were artificially induced to 0, 1, 2, and 3 cm. The proportion of weight distribution, shift of the mean center of pressure, and Cobb's angle were measured in the standing position. Kinematic variables such as walking and striding width and time, and the proportion of stance phase for single- and double-limb gait were measured as well. The participants were required to either stand or walk on a treadmill (Zebris FDM) with a pressure plate, and the Cobb's angle measurements were obtained from radiographs.
Results: A discrepancy of 3 cm in leg length resulted in a statistically significant shift of the center of pressure in the standing position. Moreover, the Cobb angle increased as the discrepancy became larger. The step length and width of the longer (left) leg during gait statistically significantly increased when the discrepancy was 2 cm. In addition, step time was statistically significant when the discrepancy between the longer (right) and shorter (left) legs was more than 2 cm. The proportion of single-limb stance phase was statistically significant as the discrepancy became larger, especially when the discrepancy was >2 cm for the longer (right) leg and 1 cm for the shorter (right) leg.
Conclusion: The study showed that LLD influenced deformations of the human body and walking.
Keywords
Leg Length Discrepancy (LLD) Gait Spine Cobb's Angle Zebris FDM Radiograph
Leg length discrepancy (LLD) refers to an asymmetry between the two legs (McCaw & Bates, 1991) and can be divided into structural and functional LLDs. LLD has a considerable effect on the body in terms of walking and daily activities. In severe cases, it can even cause gait abnormalities and pelvic and spinal imbalance. The body maintains left-right balance of the pelvis and spine, but LLD produces a state of imbalance. Thus, methods of measuring leg length are important in examinations for musculoskeletal disorders.
LLD can also be caused by left-right asymmetry of the pelvis, which causes asymmetric development of the muscles surrounding the pelvis, such as the quadratus lumborum and iliopsoas (Ahn, 2004). This in turn leads to postural changes such as tonic neck reflexes of the cervical spine (Burcon, 2003). Moreover, when an artificial LLD was induced, subjects showed significant differences in hip, knee, and ankle joint angles during walking (Gurney, Mermier, Robergs, Gibbson & Rivero, 2001; Jung, 2002).
LLD originates from poor posture and lifestyle habits. Although it has little effect on the body when mild, LLD that results from long-term exposure to poor posture can disrupt the proper alignment of the body, inducing defor- mity in parts of the body to compensate for the misalign- ment. Changes in the body's alignment can lead to severe musculoskeletal disorders (Perttunen, Anttila, Sodergard, Merikanto & Komi, 2004).
LDD causes gait imbalance; specifically, it reduces the stance phase time on the side of the short leg, and the pressure on the sole of the foot on the longer side in-creases below the first digit. Hence, the time for the heel to leave the ground becomes shorter, producing gait disa- bilities (Kang, 2006; Perttunen et al., 2004).
During walking, the first part of the body that supports the load is the lower limb, and the joints of the lower limb are the hip, knee, and ankle. Organic movement of these joints plays an important role in the stability of the body, preventing injury, and performing healthy functions (Yoon, Jeon, Shin, & Park, 1990). Carlson and Wilkerson (2007) reported that LLD causes pain in the lateral patellofemoral region. Meanwhile, LLD can aggravate degenerative arthritis in the hip and knee joints, and the persistent body-weight load during walking can induce biomechanical changes in the joints and symmetrical gait (Golightly et al., 2007).
Structural LLD has a negative effect on the synergistic action of the joints, increasing intra-articular pressure and tension. This ultimately increases the tension at the muscle insertions, causing imbalance of the body. Among studies of the impact of LLD on the spine, the study of Ames (2005) reported that it affects the maintenance of static posture and that it can produce pelvic imbalance by causing valgus in the standing posture. This eventually results in functional scoliosis of the lumbar spine in the direction of the shorter leg (Friberg, 1983).
Bolz and Davies (1984) reported that the muscle strength on the side of the shorter leg was lower than that on the side of the longer leg, and that factors such as balance ability, response time, and muscle strength in the trunk and upper limb were affected by LLD. In a study on the association of LLD with leg and foot stress fractures, Friberg (1983) reported that although no major issues were found for individuals who did not exercise, those who had LLD of ≥10 mm increased activity in certain muscle groups, causing serious problems.
Similarly, in other studies, LLD was reported to cause body imbalance and related problems, but the specific importance of the extent of LLD in these changes has not yet been clearly revealed. Moreover, most previous studies only discussed differences and changes in static posture, without any analysis on the effects of LLD during move-ment. Finally, studies on the effect of LLD on Cobb's angle and on numerous variables during walking are lacking.
As such, research is urgently needed to determine the extent of LLD that requires a corrective prescription when using insoles as a means of preventing body imbalance due to LLD. Furthermore, the effects of correcting LLD with insoles should be investigated by measuring compen- satory spinal curvature and analyzing changes in exercise parameters during walking.
This study aimed to investigate the effects of LLD on the body in the standing posture and during walking. Specifically, healthy subjects with no LLD wore 1-, 2-, or 3-cm insoles to create an artificial LLD. Cobb's angle and gait related- kinematic parameters were measured and compared in the standing position and during walking. We hope that the results can be used as the underlying data for corrective prescriptions (shoe lift or heel lift) for LLD.
1. Subjects
The subjects in this study consisted of 17 healthy re-sidents of I—City who were in their twenties. The mean age, height, and weight of the subjects were 25.76 ± 1.76 years, 167.12 ± 7.39 cm, and 64.94 ± 10.57 kg, respectively. The mean left leg length, right leg length, and difference in length between the two legs were 84.95 ± 5.03 cm, 84.89 ± 4.76 cm, and 0.40 ± 0.26 cm, respectively. The details of the subjects' characteristics are displayed in Table 1.
|
Subject |
Age |
Height (cm) |
Weight (kg) |
Left leg length (cm) |
Right leg length (cm) |
Leg length discrepancy (cm) |
|
1 |
25 |
177 |
70.9 |
94.13 |
93.50 |
0.63 |
|
2 |
27 |
170 |
79.6 |
86.00 |
85.13 |
0.87 |
|
3 |
24 |
163 |
71.7 |
79.60 |
80.43 |
-0.83 |
|
4 |
24 |
159 |
55 |
76.77 |
77.00 |
-0.23 |
|
5 |
26 |
158 |
52.1 |
80.40 |
80.83 |
-0.43 |
|
6 |
27 |
158 |
47.8 |
78.20 |
78.37 |
-0.17 |
|
7 |
26 |
167 |
57.1 |
83.93 |
84.27 |
-0.33 |
|
8 |
28 |
164 |
66.4 |
84.17 |
84.27 |
-0.10 |
|
9 |
28 |
176 |
81.8 |
89.53 |
89.17 |
0.37 |
|
10 |
25 |
157 |
63.5 |
79.97 |
80.07 |
-0.10 |
|
11 |
27 |
173 |
77.8 |
88.00 |
87.33 |
0.67 |
|
12 |
25 |
161 |
53 |
83.10 |
82.73 |
0.37 |
|
13 |
29 |
166 |
57.8 |
84.10 |
84.43 |
-0.33 |
|
14 |
25 |
172 |
72.8 |
85.33 |
85.13 |
0.20 |
|
15 |
23 |
168 |
60.8 |
88.60 |
88.97 |
-0.37 |
|
16 |
23 |
170 |
59.9 |
92.90 |
92.80 |
0.10 |
|
17 |
25 |
182 |
76 |
89.47 |
88.73 |
0.73 |
|
M ± |
25.76 |
167.12 |
64.94 |
84.95 |
84.89 |
.40 |
2. Experimental apparatus
In this study, Cobb's angle was measured by using the radiographic device CTTT (SC-1002, South Korea). Kine-matic parameters in a static posture and during walking were measured by using Zebris FDM. Specific details of the research instruments are displayed in Table 2.
|
Division |
Equipment |
Model |
Company, |
|
Gait |
Zebris |
Zebris FDM |
Zebris
Medical, |
|
Cobb's |
Radiograph |
CTTT (SC-1002) |
Shin
Young For |
3. Experimental procedure
In order to measure Cobb's angle and gait parameters according to LLD, the study design and procedures were explained thoroughly to all the subjects before the start of the experiment. Only those who gave their voluntary consent participated in the experiment.
After recording the subjects' age, height, and weight, the tape measure method (TMM) was used to measure their leg length while lying down. The subjects were restricted to those with LLD of <1 cm, without history of surgery for congenital deformity or trauma of the lower limb, and without pain in the lower back or lower limb.
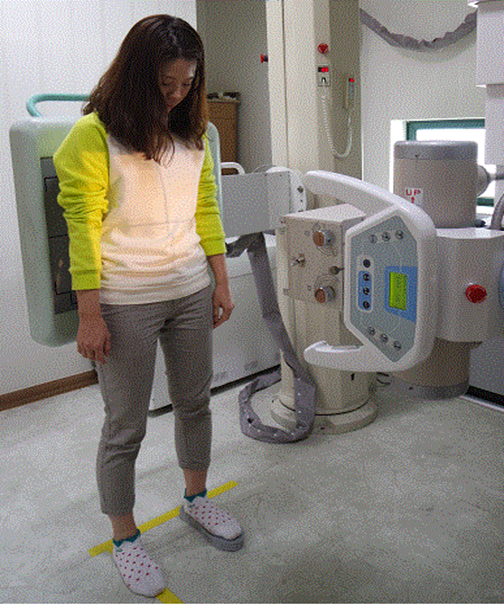
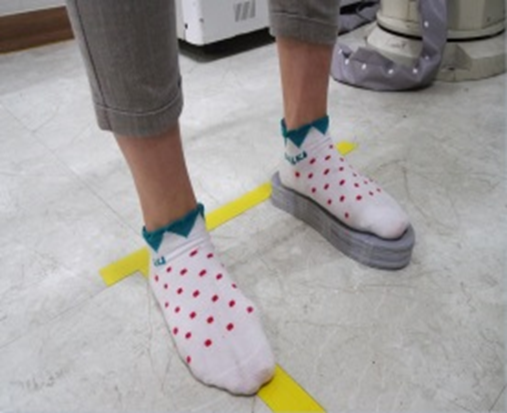
Artificial LLD was induced by using insoles, with the left leg as the longer leg. Specifically, 5-mm insoles from A— Company were connected to make heights of 0 cm (type 1), 1 cm (type 2), 2 cm (type 3), and 3 cm (type 4). Here, differences in leg length of 1 and 2 cm corresponded to 1% of the subjects' mean height, and a 3-cm difference corresponded to 2% of the mean height. Radiographic imaging to measure Cobb's angle was performed at the B— Orthopedic Clinic. As shown in Figure 1, subjects stood with both knees in extension and feet at shoulder width. Differences in leg length were induced by using the insoles to make the left leg longer, as shown in Figure 2.
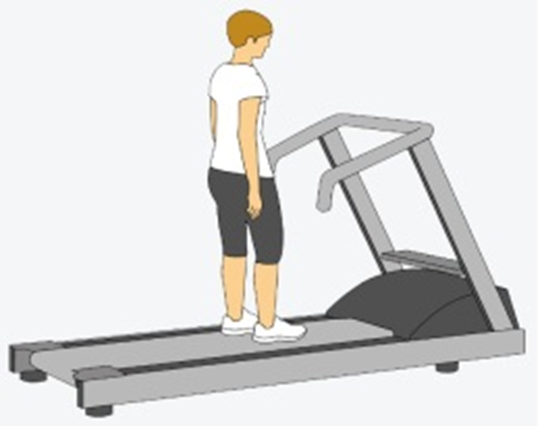
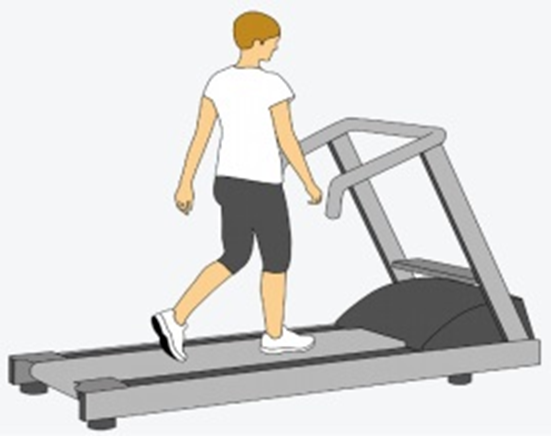
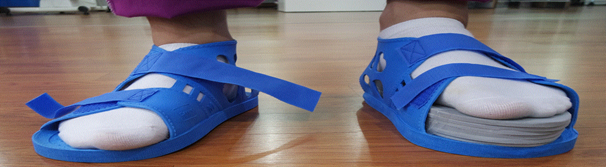
Measurement of gait parameters was conducted on a treadmill equipped with a pressure pad (Zebris FDM) in both the standing posture and while walking (Figures 3 and 4). LLD was induced by using insoles to make the left leg longer, as with radiographic imaging. As shown in Figure 5, the insoles were worn inside medical shoes. In order to adapt to the artificial LLD, the subjects were made to walk on the treadmill for 5 minutes at a speed of 4.9 ± 0.1 km/h for each height. Measurements were per-formed during the last 1 minute of walking.
4. Measured variables
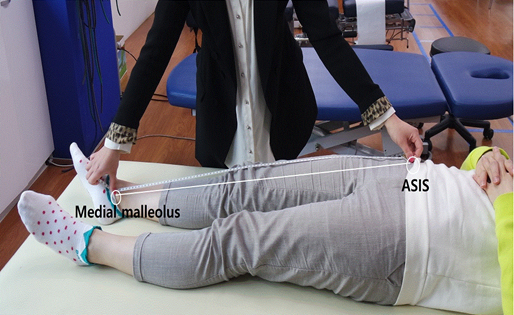
This study measured kinematic parameters in the standing posture and during walking in order to determine how they are affected by LLD. Leg length was first measured by using the TMM from the anterior superior iliac spine to the medial malleolus, with the subject lying on a bed, as shown in Figure 6 (Beattie, Isaacson, Riddle, & Rothstein, 1990). In order to make an accurate measurement of leg length, the patient wore light clothes, and the most pro-truded part of the medial malleolus was marked with a pen before taking the measurement. In order to improve the reliability of the measurement, measurements were taken 3 times and the mean was used.
Compensating factors to maintain a standing posture with LLD were measured, specifically the left and right body weight distributions, center of pressure (COP) path length, and Cobb's angle. Gait parameters were also measured, including step length, step time, stride length, stride time, percentage of time in single-leg support, and percentage of time in double-leg support. Step length was measured as the distance from the heel of one foot to the heel of the other foot during walking, and step time was measured as the time taken for completing a step. Stride length was the distance from the heel of one foot to the heel of the same foot while walking, and stride time was the time taken for completing a stride.
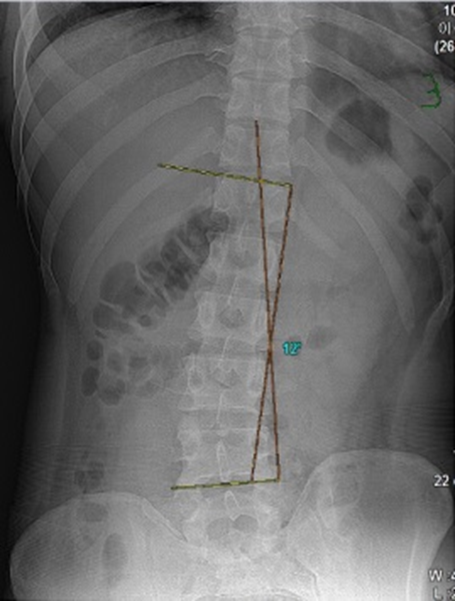
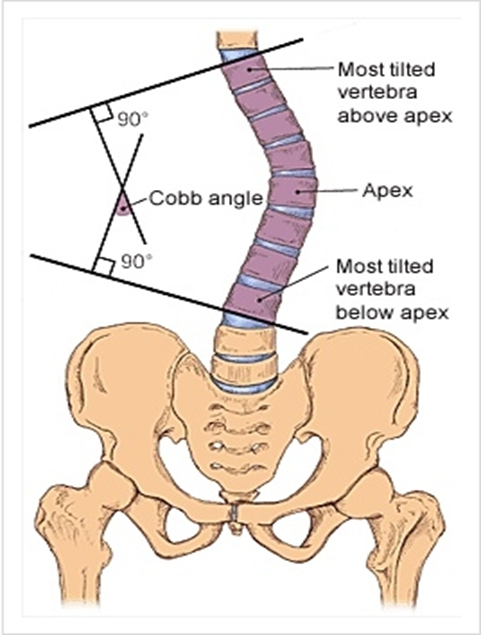
Cobb's angle was measured as shown in Figures 7 and 8. A line was drawn from the superior endplate of the most tilted vertebra on the upper part of the curvature of interest, and another line was drawn from the inferior endplate of the vertebra at the bottom of the curvature. Drawing perpendiculars from each of these lines, the angle between the two perpendiculars was taken as Cobb's angle (Deacon et al., 1984). With consultation from an ortho-pedic specialist, measurements were made in the same way for all the subjects by using the superior endplate of T12 and the inferior endplate of L4.
5. Statistical analyses
All statistical analyses in this study was performed by using the statistical program SPSS 20.0 for Windows. The mean and standard deviation were calculated for all mea-sured variables, and repeated-measures one-way analysis of variance (ANOVA) was used to test for differences be-tween the means under different experimental conditions. When the ANOVA showed significant results, post hoc testing was performed by using Duncan's multiple range test. A statistical significant level of α = .05 was used throughout the experiment.
1. Static changes due to LLD
Table 3 shows the mean and standard deviation for left and right body weight distributions, COP path length, and Cobb's angle when an artificial difference in leg length was introduced in a static, standing position, supporting the body weight on both feet.
As shown in Table 3, in the standing position, the mean left and right distributions were as follows: for type 1, 49.92% ± 4.63% and 50.08% ± 4.63%, respectively; for type 2, 51.32% ± 6.53% and 48.68% ± 6.53% respectively; for type 3, 50.83% ± 8.58% and 49.17% ± 8.58%, respec- tively; for type 4, 49.75% ± 14.06% and 50.25% ± 14.06%, respectively.
|
Division |
Type |
Left |
Right |
|
Mean (%) |
1 |
49.92 ± 4.63 |
50.08 ± 4.63 |
|
2 |
51.32 ± 6.53 |
48.68 ± 6.53 |
|
|
3 |
50.83 ± 8.58 |
49.17 ± 8.58 |
|
|
4 |
49.75 ± 14.06 |
50.25 ± 14.06 |
Table 4 shows the results of one-way ANOVA performed to determine any significant differences between the types. No significant differences in left and right body weight distributions were found between the types.
|
Division |
Sum of squares |
Degree |
Mean |
F |
p |
Post hoc |
|
|
Mean
distribution (%) |
Left |
28.32 |
3 |
9.44 |
.24 |
.869 |
|
|
1897.72 |
48 |
39.54 |
|||||
|
Right |
28.32 |
3 |
9.44 |
.24 |
.869 |
||
|
1897.72 |
48 |
39.54 |
|||||
As can be seen in Table 5, the COP path length was 49.81 ± 21.70 mm for type 1, 65.71 ± 32.68 mm for type 2, 60.38 ± 22.93 mm for type 3, and 83.16 ± 34.05 mm for type 4. Cobb's angle was -1.76° ± 4.51° for type 1, 0.76° ± 5.08° for type 2, 4.06° ± 5.36° for type 3, and 8.59° ± 5.81° for type 4.
|
Division Type |
COP path length (mm) |
Cobb's angle (degrees) |
|
1 |
49.81 ± 21.70 |
-1.76 ± 4.51 |
|
2 |
65.71 ± 32.68 |
.76 ± 5.08 |
|
3 |
60.38 ± 22.93 |
4.06 ± 5.36 |
|
4 |
83.16 ± 34.05 |
8.59 ± 5.81 |
Table 6 shows the results of one-way ANOVA performed to determine any differences in COP path length Cobb's angle between the types. The results showed significant differences in COP path length according to type (p < .002), and post hoc testing revealed a significant relationship of 1 = 2 = 3 < 4. Significant differences in Cobb's angle according to type (p < .000) and post hoc testing revealed a significant relationship of 1 < 2 < 3 < 4.
|
Division |
Sum
of squares |
Degree |
Mean |
F |
p |
Post |
|
COP
path (mm) |
9899.17 |
3 |
3299.72 |
5.95 |
.002 |
1 =
2 = 3<4 |
|
26619.10 |
48 |
554.56 |
||||
|
Cobb's (degrees) |
1020.29 |
3 |
340.10 |
103.19 |
.000 |
1<2 <4 |
|
158.21 |
48 |
3.30 |
|
Division |
Type |
Left |
Right |
|
Step length (cm) |
1 |
64.00 ± 6.45 |
63.29 ± 6.36 |
|
2 |
64.71 ± 6.65 |
61.82 ± 6.26 |
|
|
3 |
65.71 ± 7.35 |
62.35 ± 6.74 |
|
|
4 |
66.35 ± 8.76 |
62.41 ± 7.38 |
| Division | Sum of squares | Degree of freedom | Mean square | F | p | Post hoc test | |
| Step length(cm) | Left | 55.57 | 3 | 18.53 | 4.80 | .005 | 1 = 2 < 3 = 4 |
| 185.18 | 48 | 3.86 | |||||
| Right | 18.94 | 3 | 6.31 | 1.68 | .183 | ||
| 180.06 | 48 | 3.75 | |||||
2. Dynamic changes due to LLD
Changes in step length, step time, stride length, stride time, single-leg support, and double-leg support were measured during walking for artificial LLD of 1, 2, or 3 cm. The results are displayed in Tables 7-11.
As shown in Table 7, step length for type 1 was 64.00 ± 6.45 cm on the left side and 63.29 ± 6.36cm on the right side. Step length for Type 2 was 64.71 ± 6.65 cm on the left side and 61.82 ± 6.26 cm on the right side. Step length for Type 3 was 65.71 ± 7.35 cm on the left side and 62.35 ± 6.74 cm on the right side. Step length for Type 4 was 66.35±8.76 cm on the left side and 62.41 ± 7.38 cm on the right side.
|
Division |
Type |
Left |
Right |
|
Step length (cm) |
1 |
64.00 ± 6.45 |
63.29 ± 6.36 |
|
2 |
64.71 ± 6.65 |
61.82 ± 6.26 |
|
|
3 |
65.71 ± 7.35 |
62.35 ± 6.74 |
|
|
4 |
66.35 ± 8.76 |
62.41 ± 7.38 |
Table 8 shows the results of the one-way ANOVA per-formed to determine any differences in right and left step length when walking between the types. The results showed a significant difference in left-side step length between the types (p < .005), and post hoc testing revealed a significant difference of 1 = 2 < 3 = 4. Conversely, no significant difference in right-side step length was observed.
|
Division |
Sum of squares |
Degree |
Mean |
F |
p |
Post |
|
|
Step length (cm) |
Left |
55.57 |
3 |
18.53 |
4.80 |
.005 |
1 = 2 |
|
185.18 |
48 |
3.86 |
|||||
|
Right |
18.94 |
3 |
6.31 |
1.68 |
.183 |
||
|
180.06 |
48 |
3.75 |
|||||
As shown in Table 9, the step time for type 1 was 0.63 ± 0.055 sec on the left side and 0.62 ± .0.06 sec on the right side. The step time for type 2 was 0.62 ± 0.064 sec on the left side and 0.63 ± 0.06 sec on the right side. The step time for type 3 was 0.61 ± 0.048 sec on the left side and 0.63 ± 0.06 sec on the right side. The step time for type 4 was 0.61 ± 0.046 sec on the left side and 0.66 ± 0.06 on the right side.
|
Division |
Type |
Left |
Right |
|
Step time (sec) |
1 |
0.63 ± .055 |
0.62 ± 0.06 |
|
2 |
0.62 ± .064 |
0.63 ± 0.06 |
|
|
3 |
0.61 ± .048 |
0.65 ± 0.06 |
|
|
4 |
0.61 ± .046 |
0.66 ± 0.06 |
Table 10 shows the results of the one-way ANOVA per-formed to determine significant differences in right and left step times when walking between the types. The results showed a significant difference in left step time (p < .000), with a post hoc test confirming the significant difference with a pattern of 1 = 2 > 3 = 4. A significant difference in right step time (p < .000) was also found, with a post hoc test confirming the significant difference with a pattern of 1 = 2 < 3 = 4.
|
Division |
Sum of squares |
Degree |
Mean |
F |
p |
Post |
|
|
Step
time (sec) |
Left |
.01 |
3 |
.00 |
8.20 |
.000 |
1 = 2 > 3 |
|
.01 |
48 |
.00 |
|||||
|
Right |
.01 |
3 |
.00 |
8.79 |
.000 |
1 = 2 < 3 |
|
|
.03 |
48 |
.00 |
|||||
As shown in Table 11, the mean stride length was 127.47 ± 12.58 cm for type 1, 126.59 ± 12.86 cm for type 2, 128.18 ± 14.12 cm for type 3, and 129.00 ± 15.92 cm for type 4. The mean stride time was 1.25 ± 0.11sec for type 1, 1.25 ± 0.13 sec for type 2, 1.26 ± 0.10 sec for type 3, and 1.26 ± 0.10 sec for type 4. Table 12 shows the results of the one-way ANOVA performed to determine significant differences in stride length and time between the types. The results show no significant differences.
As shown in Table 13, the proportion of time in single-leg support for type 1 was 34.13% ± 1.51% on the left side and 34.68% ± 1.04% on the right side. For type 2, the proportion of single-leg support time was 34.49% ± 1.51% on the left side and 34.21% ± 1.11% on the right side. For type 3, the proportion of single-leg support time was 35.41% ± 1.60% on the left side and 33.92% ± 1.11% on the right side. For type 4, proportion of single-leg support time was 35.78% ± 1.75% on the left side and 33.39% ± 1.27% on the right side.
Table 14 shows the results of the one-way ANOVA per-formed to determine significant differences in right- and left-side single-leg support between the types. The results showed significant differences in both left- and right-side single-leg support between the types (p < .000). A post hoc test showed a significant difference of 1 = 2 < 3 = 4 on the left side and 1 > 2 = 3 > 4 on the right side.
|
Division Type |
Stride length |
Stride time |
|
1 |
127.47 ± 12.58 |
1.25 ± 0.11 |
|
2 |
126.59 ± 12.86 |
1.25 ± 0.13 |
|
3 |
128.18 ± 14.12 |
1.26 ± 0.10 |
|
4 |
129.00 ± 15.92 |
1.26 ± 0.10 |
|
Division |
Sum of
squares |
Degree |
Mean |
F |
p |
Post |
|
Stride
length (cm) |
53.69 |
3 |
17.90 |
1.35 |
.269 |
|
|
636.06 |
48 |
13.25 |
||||
|
Stride (sec) |
.00 |
3 |
.00 |
.45 |
.716 |
|
|
.06 |
48 |
.00 |
|
Division |
Type |
Left |
Right |
|
Single-leg |
1 |
34.13 ± 1.51 |
34.68 ± 1.04 |
|
2 |
34.49 ± 1.51 |
34.21 ± 1.11 |
|
|
3 |
35.41 ± 1.60 |
33.92 ± 1.11 |
|
|
4 |
35.78 ± 1.75 |
33.39 ± 1.27 |
|
Division |
Sum of squares |
Degree |
Mean |
F |
p |
Post |
|
|
Single-leg
support (%) |
Left |
30.22 |
3 |
10.07 |
25.28 |
.000 |
1 = 2 |
|
19.12 |
48 |
.40 |
|||||
|
Right |
14.95 |
3 |
4.98 |
9.68 |
.000 |
1 > |
|
|
24.71 |
48 |
.52 |
|||||
As shown in Table 15, the mean proportion of time in double-leg support was 31.23% ± 2.22% for type 1, 31.30% ± 2.07% for type 2, 30.67% ± 2.13% for type 3, and 30.84% ± 2.26% for type 4. Table 16 shows the results of the one-way ANOVA performed to determine any signifi- cant difference in double-leg support time during walking between the types. However, no significant difference was found.
|
Division Type |
Total double-leg support (%) |
|
1 |
31.21 ± 2.22 |
|
2 |
31.30 ± 2.07 |
|
3 |
30.67 ± 2.13 |
|
4 |
30.84 ± 2.26 |
|
Division |
Sum
of squares |
Degree |
Mean
square |
F |
p |
Post |
|
Total
double- (%) |
4.60 |
3 |
1.53 |
1.84 |
.152 |
|
|
39.89 |
48 |
.83 |
Correct posture refers to the ideal musculoskeletal align- ment and involves straightening the spine to maintain a healthy spinal curvature. In addition, it is important that the body does not lean to one side in order to maintain a proper balanced state and that muscles and joints are not placed under too much stress. Posture affects the pressure on the structures that support and protect the body, which in turn affects the body (Kim, & Kim, 2007). Good posture refers to a state of musculoskeletal balance that protects the support structures of the body, whether sitting or standing, in order to prevent injury and progres- sive deformation. Good posture allows muscles to function with optimal efficiency, and the ideal posture provides the best positions for the internal organs (Ju, 2008).
Balance is the ability to keep the center of gravity over the base in a straight posture; in other words, it is the ability to maintain physical posture against gravity (Hwang, 1997). Balance is an essential element in maintaining good posture, and an even distribution of body weight across both feet is ideal. When COP path length, which is indicative of balance ability, was measured in this study, results indicated that COP path length increased signifi-cantly with increasing LLD as follows: 49.81 ± 21.70 mm in type 1, 65.71 ± 32.68 mm in type 2, 60.38 ± 22.93 mm in type 3, and 83.16 ± 34.05 mm in type 4. A post hoc test confirmed significant differences between types 1 and 4, and between types 3 and 4.
These results are partially consistent with those of a study by Ji, Kim, Lee, and Cha (2012), who investigated the effects of task-oriented training on balance ability in degenerative arthritis patients who had undergone total knee replacement. In their study, a 12-person task-oriented training group and a 12-person weight-shift training group participated in their respective exercise programs 5 times per week for 2 weeks before undergoing a test of static balance ability (COP path length). The test group showed a significant reduction from 116.17 ± 20.74 mm to 91.47 ± 14.40 mm, while the control group showed a significant reduction from 113.17 ± 11.61 mm to 106.78 ± 11.50 mm. In other words, COP path length showed an increase when lower limb stability was impaired, and our study also found an increase in COP path length, indicating a decrease in balance ability, when instability was increased by artificial LLD.
Even weight distribution across the two legs is an impor- tant factor in maintaining proper posture. However, in standing position, hemiplegic patients support <25~43% of their body weight on the injured side, producing an asymmetric posture (Yang, Chung, Lee, Cheng, & Wang, 2007). Such a posture causes problems with postural con- trol ability due to reduced ability to maintain the body's center, and impaired righting and equilibrium reactions (Ikai, Kamiubo, & Takenhara, 2003). In a study on body weight loads in structural short leg (SSL), patients with SSL tended to shift their weight toward the short side, but subjects with SSL of at least 6 mm tended to shift their weight toward the opposite side. These results indicate a compensatory action (e.g., by gluteus medius) and that in subjects with SSL of at least 6 mm, the gluteus medius shifts the weight toward the opposite side in order to balance the pelvis (Lawrence, 1984).
Kwon, HwangBo, and Kim (1993) compared body weight distribution in healthy individuals and low back pain patients when standing straight. They reported that no significant difference between the two groups. In other words, healthy individuals also showed differences in body weight allocation between their two legs. Even right footers do not necessarily distribute their weight more toward the right side, and patients do not show a low distribution of body weight toward the painful side. Our study also showed no statistical significance in the impact of LLD on body weight distribution. LLD has been reported to cause scoliosis (Friberg, 1983), and Papaioannou (1982) stated that LLD of ≥22 mm can cause compensatory scoliosis. When Cobb's angle was measured in this study, the mean angle was 1.76° ± 4.51° for type 1, 0.76° ± 5.08° for type 2, 4.06° ± 5.36° for type 3, and 8.59° ± 5.81° for type 4, which means that Cobb's angle increased with increasing LLD. This is consistent with the results of previous studies.
When gait is unstable, step and stride length are re-ported to show decreasing trends with increasing age (Patla, 1993). When step length was measured in this study, increased LLD was associated with significantly longer step length on the side of the long leg and with reduced step length on the side of the short leg, although the difference was not statistically significant. Generally, when individuals with LLD walk, the center of gravity of the body causes the shorter leg to drop and the longer leg to rise in the stance phase, increasing vertical movement, which results in greater energy use (Gurney, 2001). The gait characteristics in such individuals include a shorter swing phase, a shorter step length on the short side, reduced walking speed, and increased cadence (Bhave, Paley, & Herzenberg, 1999).
However, although our study showed a similar decrease in step length on the shorter side with increased LLD, this was not statistically significant. Meanwhile, the step length on the longer side increased with a statistical significance LLD has a negative effect on gait in the elderly by in-fluencing the economy of gait and muscle activation. In one study, 44 male and female elderly individuals (55~86 years old) walked on a treadmill with an artificial LLD of 2, 3, or 4 cm; oxygen intake, breathing rate, and heart rate were measured, as well as muscle activity in the plantar flexors, rectus femoris, gluteus medius, and gluteus maximus using electromyography.
The results showed an increase in heart rate, oxygen intake, and breathing rate at an artificial LLD of 2 cm, an increase in rectus femoris activity in the long leg at LLD of 3 cm, and an increase in plantar flexor activity in the short leg at LLD of 4 cm (Gurney et al., 2001). The single-leg support phase was significant on the right and left sides, decreasing for the long leg and increasing for the short leg with increasing LLD. This is thought to be because larger LLD led to a relative reduction in stability on the long side, and the increase in support phase on the short side was a compensatory action.
No statistically significant change in stride length, stride time, or double-leg support phase were observed. This is thought to be because changes in the long and short legs offset each other owing to compensatory action. Although a large number of previous studies have dealt with these issues in LLD, several hypotheses have been proposed about the extent of LLD that has an impact. A significant difference has been reported at LLD of at least 2 cm, while correction using insoles is required at LLD of at least 2.5 cm. However, in observing the effects of LLD on standing posture and gait, our study showed a change in Cobb's angle at LLD of 1 cm, suggesting that cor-rection is required even at shorter LLD than at the LLD of 2.5 cm recommended in a previous study. Moreover, the taller subjects in this study showed a slightly higher LLD, suggesting the need for future studies that take into account the subjects' heights.
This study aimed to investigate the effect of LLD on the body by examining its effect on gait parameters and Cobb’s angle during standing and walking. To this end, we selected 17 subjects in their twenties with LLD of less than 1 cm and fitted them with insoles for the left leg that created an artificial LLD of 1, 2, or 3 cm to form groups for analysis. For each group, the COP path length and Cobb's angle were measured in a standing posture, as well as the gait parameters such as step length, step time, stride length, stride time, single-leg support time, and double-leg support time. All the data obtained in this study were processed by using the statistics program SPSS 20.0 for Windows (IMB, USA), and the mean and standard deviation were calculated for all measured vari-ables. One-way repeated-measures ANOVA was performed to test for differences between groups, and Duncan's post hoc test was used on any significant results of the analysis. The statistical significant level for all the tests was α = .05. The results led to the following conclusions:
1. COP path length was significantly longer when LLD was at least 3 cm, and compensatory Cobb's angle was significantly larger with increasing LLD. This shows that LLD influenced physical deformation in the standing posture.
2. When walking, LLD of at least 2 cm showed a signifi-cant difference in step length on the left (long) side, step time on the left (long) and right (short) sides, and single-leg support time on the left (long) side. Single-leg support time on the right (short) side showed a significant difference at 1-cm LLD.
References
1. Ahn, M. (2004). The effects of postural correction on pelvis balance and cervical range of motion. Unpublished master's thesis, Daegu University, Daegu.
Crossref
2. Ames, R. A. (1985). Posture in the assessment, diagnosis and treatment of chronic low back pain. J Aust Chiropr Assoc, 15, 21-31.
Crossref
3. Beattie, P., Isaacson K., Riddle D. L. & Rothstein, J. M. (1990). Validity of derived measurements of leg-length dif- ferences obtained by use of a tape measure. Physical therapy, 70(3), 150-157.
Crossref
Google Scholar
PubMed
4. Bhave, A., Paley, D. & Herzenberg, J. E. (1999). Impro-vement in gait parameters after lengthening for the treatment of limb-length discrepancy. The Journal of Bone & Joint Surgery, 81(4), 529-534.
Crossref
Google Scholar
PubMed
5. Bolz, S. & Davies, G. J. (1984). Leg length differences and correlation with total leg strength. Journal of Ortho- paedic & Sports Physical Therapy, 6(2), 123-129.
Crossref
Google Scholar
PubMed
6. Bunnell, W. P. (1986). The natural history of idiopathic scoliosis before skeletal maturity. Spine, 11(8), 773-776.
Crossref
Google Scholar
PubMed
7. Burcon, M. (2003). Assessment of the cervical spine using modified Prill leg Checks. 11th Annual Vertebral Sub- luxation. Research Conference.
Crossref
8. Carlson, M. & Wilkerson, J. (2007). Are differences in leg length predictive of lateral patello-femoral pain?. Phy- siotherapy Research International, 12(1), 29-38.
Crossref
Google Scholar
PubMed
9. Choi, H. S. & Min, K. J. (2000). The effect of the early therapeutic exercise on idiopathic scoliosis in elem- entary school children in seosan city. Korean research society of physical therapy, 3, 1-18.
Crossref
Google Scholar
10. Dahl, M. T. (1996). Limb Length Discrepancy. Pediatric Clinic of North America, 43(4), 849-865.
Crossref
PubMed
11. Deacon, P., Flood, B. M. & Dickson, R. A. (1984). Idiopathic scoliosis in three dimensions. A radiographic and mor- phometric analysis. Journal of Bone & Joint Surgery, British Volume, 66(4), 509-512.
Crossref
Google Scholar
PubMed
12. Dirocco, P. J. & Vaccaro, P. (1998). Cardiopulmonary func-tioning in ddolescent patients with mild idiopathic scoliosis. Archives of physical medicine and rehabili- tation, 69(3), 198-201.
Crossref
PubMed
13. Friberg, O. (1983). Clinical symptoms and biomechanics of the lumbar spine and hip joint in leg-length inequality. Spine, 8(6), 643-651.
Crossref
Google Scholar
PubMed
14. Gailliet, R. (1990). Disorders and deformities. Philadelphia: WB Saunders, 792-809.
Crossref
15. Giles, L. G. (1981). Lumbosacral facetal 'joint angles' asso-ciated with leg length inequality. Rheumatol. Rehabil., 20(4), 233-238.
Crossref
Google Scholar
PubMed
16. Golightly, Y. M., Allen, K. D., Renner, J. B., Helmick, C. G., Salazar, A. & Jordan, J. M. (2007). Relationship of limb length inequality with radiographic knee and hip osteoarthritis. Osteoarthritis and Cartilage, 15(7), 824-829.
Crossref
Google Scholar
PubMed
17. Gong, W. T. (2008). The influence of contract-relax tech- nique of PNF & sacroiliac jont mobilization of func- tional leg length inequality. Unpublished Doctor's Thesis, Daegu University, Gyeongbuk, Korea.
Crossref
18. Gurney, B., Mermier, C., Robergs, R., Gibbson, A. & Rivero, D. (2001). Effects of limb-length discrepancy on gait economy and lower-extermity muscle activity in older adults. The Journal of Bone and Joint Surgery, 83-A(6), 907-915.
Crossref
Google Scholar
PubMed
19. Hensinger, R. N. (1991). Congenital anomalies of the cervical spine. Clin Orthop., 264, 16-38.
Crossref
Google Scholar
PubMed
20. Hensinger, R. N. (1991). Congenital anomalies of the cervical spine. Clinical orthopaedics and related research, 264, 16-38.
Crossref
Google Scholar
PubMed
21. Hwang, S. S. (1997). The effects of vestibular stimulation on balance and fundamental psychological process fo children with central nervous system dysfunction. Unpublished Doctor's thesis, Dankook University, Seoul, Korea.
Crossref
22. Ikai, T., Kamikubo, T. & Takenhara, I. (2003). Dynamic Pos-tural Control in Patients with hemiparesis. American journal of physical medicine & rehabilitation, 82(6), 463-469.
Crossref
PubMed
23. Jang, M. J. & Cho, H. J. (2010). The effect of performing a 12 weeks's exercise program on the change of cobb's angle of disabled adolescents with idiopathic scoliosis. Korean journal of adapted physical activity, 18(4), 117 -127.
Crossref
24. Jeon, W. J. (2010). Interrelationship between difference in leg length of th lower limbs and the balance of the upper limbs musculoskeletal system of the students majoring in physical education: Through moire muscle somatotype photography. Unpublished Master's thesis, Myongji University, Seoul, Korea.
Crossref
25. Ji, S. G., Kim, M. K., Lee, D. G. & Cha, H. K. (2012). Effect of task-oriented exercise on the balance in degenerative arthritis patients with total knee replacement. The Journal of the Korea Contents Association, 12(3), 222 -232.
Crossref
Google Scholar
26. Ju, H. Y. (2008). Effects of differences in shoulder height, leg length and foot arch height on weight distribution. Unpublished Master's thesis, Dongshin University, Jeon- nam, Korea.
Crossref
27. Jung, Y. J. (2002). Effects of leg length discrepancy on kinemetic parameters during walking. Unpublished Master's thesis, Yousei University, Gangwon, Korea.
Crossref
28. Kang, H. S. (2006). Effects of the bareunmom (straight body form) physical exercise therapy on shoulder pain. Un- published Master's Thesis, Chosun University, Gwangju, Korea.
Crossref
29. Kaufman, K. R., Miller, L. S. & Sutherland, D. H. (1996). Gait Asymmetry in Patients with Limb-Length Inequality. Journal of Pediatric Orthopaedics, 16(2), 144-150.
Crossref
Google Scholar
PubMed
30. Kim, S. & Kim, J. S. (2007). Knowledge of good posture and postural habits in elementary school children. Child health nursing research, 13(2), 182-190.
Crossref
Google Scholar
31. Kwon, M. J., HwangBo, G. & Kim, J. S. (1993). The com-parison of weight distribution between the healthy per- sons and low back pain patients during standing pos- ture. The Journal of Korea society of physical therapy, 5(1), 9-15.
Crossref
32. Lawrence, D. (1984). Lateralization of wight in the presence of structural short leg. Journal of Manipulative and Physiologiacal Therapeutices, 7(2), 105-108.
Crossref
Google Scholar
PubMed
33. Lee, W. J. & Lim, C. H. (2012). Effect of unstable surface lumbar stabilization exercise on trunk posture and balance ability in patients with scoliosis. Journal of the korean society of physical medicine, 7(1), 59-67.
Crossref
Google Scholar
34. Mahar, R. K., Kirby, R. L. & MacLeod, D. A. (2005) Simulated leg-length discrepancy: its effect on mean center-of- pressure position and postural sway. Arch Phys Med Rehabil, 66(12), 822-824.
Crossref
PubMed
35. McCaw, S. T. (1992). Leg length inequality Implications for running injury prevention. Sports Med, 14(6), 422-429.
Crossref
Google Scholar
PubMed
36. Moseley, C. F. (1986). Leg-Length Discrepancy. Pediatric Clinics of North America, 33(6), 1385-1394.
Crossref
Google Scholar
PubMed
37. Murray, M. P., Drought, A. B. & Kory, R. C. (1964). Walking patterns of normal men. Jounal of Bone Joint Surgery, 46, 335-360.
Crossref
PubMed
38. O'Brien, S., Kernohan, G., Fitzpatrick, C., Hill, J. & Beverland, D. (2010). Perception of imposed leg length inequality in normal subjects. Hip international: the journal of clinical and experimental research on hip pathology and therapy, 20(4), 505-511.
Crossref
Google Scholar
PubMed
39. Papaioanou, T., Stokes, I. & Kenwright, J. (1982). Scoliosis associated with limb-length inequality. J Bone Joint Surg. Am., 64(1), 59-62.
Crossref
Google Scholar
PubMed
40. Park, B. G. (2012). Relationships between differences in shoulder height, leg length, arch height and weight distribution on anthropometric variables. The korea journal of sports science, 21(4), 1199-1213.
Crossref
41. Park, Y. S. & Lim, Y. T. (2014). Effects of the functional Garment wear on Cobb's Angle and Com of trunk and pelvic during gait for Adolescent Idiopathic scoliosis patients. Korean Journal of Sport Biomechanics, 24(3), 269-275.
Crossref
Google Scholar
42. Patla, A. E. (1993). Age-related changes in visually guided locomotion over different terrains. major issues in: Amsterdam, Netherlands: Kluwer Academic.
Crossref
Google Scholar
43. Payne, W. K., Oqilvie, J. W., Resnick, M. D., Kane, R. L., Transfeldt, E. E. & Blum, R. W. (1997). Does scoliosis have a psychological impact and does gender make a difference. Spine, 22(12), 1380-1384.
Crossref
Google Scholar
PubMed
44. Perry, J. (1992). Gait analysis: Normal and Pathological Function. 1st ed., SIACK incorporated, NJ; Thorofare.
Crossref
Google Scholar
45. Perttunen, J. R., Anttila, E., Sodergard, J., Merikanto, J. & Komi, P. (2004). Gait asymmetry in patients with limb length discrepancy. Scandinavian Jorunal of Medical Science Sports, 14(1), 49-56.
Crossref
Google Scholar
46. Ramirez, N., Jonstone, C. E. & Browne, R. H. (1997). The prevalance of back pain in children who have idio- pathic scoliosis. J Bone Joint Surg Am, 79(3), 364-368.
Crossref
Google Scholar
PubMed
47. Rush, W. A. & Steiner, H. A. (1946). A study of lower extremity length inequality. The American journal of roentgenology and radium therapy, 56(5), 613-623.
Crossref
PubMed
48. Ryu, J. S. & Lim, G. Y. (2015). Impact shock components and attenuation in flat foot running. Korean Journal of Sport Biomechanics, 25(3), 283-291.
Crossref
Google Scholar
49. Strecker, W., Franzreb, M., Pfeiffer, T., Pokar, S., Wikstrom, M. & Kinzl, L. (1994). Computerized tomography meas- urement of torsion angle of the lower extremities. Unfallchirurg, 97(11), 609-613.
Crossref
Google Scholar
PubMed
50. Subotnick, S. I. (1981). Leg length discrepancies of the lower extremity. J Orthop Sports Phys Ther, 3(1), 11-16.
Crossref
Google Scholar
PubMed
51. Waidelich, H. A., Strecker, W. & Schneider, E. (1992). Com-puted tomographic torsion angle and length meas-urement of the lower extremity. The methods, normal values and radiation load. Rofo., 157(3), 245-251.
Crossref
Google Scholar
52. White S. C., Gilchist, L. A. & Wilk, B. E. (2004). Asymmetric limb loading with true or simulated leg-length dif-ferences. Clinical Orthopedic Relation Research, 421, 287-292.
Crossref
Google Scholar
PubMed
53. Winter, R. B. & Pinto, W. C. (1986). Pelvic obliquity. Its causes and its teratment. Spine, 11(3), 225-234.
Crossref
Google Scholar
PubMed
54. Woo, B. H. (2014). Characteristics for gait of the induced equinus in normal subjects. Korean Journal of Sport Biomechanics, 24(4), 435-443.
Crossref
Google Scholar
55. Yang, Y. R., Chung, Y. C., Lee, C. S., Cheng, S. J. & Wang, R. Y. (2007). Dualtask-related gaitchanges in individuals with stroke. Gait & Posture, 25(2), 185-190.
Crossref
Google Scholar
PubMed
56. Yoon, T. S., Jeon, S. I., Shin, J. S. & Park, B. G. (1990). A study of isokinetic testing at the knee comparing soccer players and non-players. Annals of rehabilitation medicine, 14(2), 260-267.
Crossref
